Illustrated guide · Operating calculations
How are water balance, recovery and concentration factor calculated?
Fix the boundary and time basis, then close water and conservative-solute balances before interpreting RO recovery or concentration.
Direct answer
Direct answer
Draw the control boundary, choose one time basis and list every stream plus storage change. The general water balance is ΣQin−ΣQout=dV/dt. For a steady RO skid without material flush, sample or leak flows, Qf=Qp+Qc and recovery Y=Qp/Qf. For a conservative solute at steady state, QfCf=QpCp+QcCc, hence Cc=(QfCf−QpCp)/Qc. Only when permeate solute is negligible and Qc=Qf(1−Y) does the ideal concentration factor become CF=Cc/Cf≈1/(1−Y): 75% recovery gives about 4×, not 1.75×. Actual species ratios change with salt passage, precipitation, dosing, reaction, leakage and analytical error; conductivity is not an exact mass concentration for every ion. Stage recoveries cannot simply be added. If stage 2 treats only stage-1 concentrate with no recycle, Ytotal=1−(1−Y₁)(1−Y₂). Batch/recirculating systems require initial/final inventory; internal recycle must not be counted as new feed at the overall boundary. Higher recovery cuts concentrate volume but raises terminal concentration, osmotic pressure and scaling risk and lowers concentrate-side flow. Use synchronized totalizers, calibrated meters and tank levels, report closure error and cross-check with a conservative ion or temperature-compensated conductivity trend.
Fix four calculation boundaries
The equations are short; boundary, time and hidden streams cause most errors.
Element, stage, pass, system or plant?
Recycle may cross a local boundary but cancel inside the overall system. Draw and name every crossing.
Snapshot steady state or cumulative period?
Tank changes, startup displacement, flush and intermittent drains require synchronized volumes plus ΔV.
Water concentration or a species?
1/(1−Y) is an ideal volume relationship; each ion needs a Q×C balance including passage and sinks/sources.
Are data on one traceable basis?
Meter range/zero, totalizer reset, level-volume curve, temperature, density and sample time must align.
Draw feed, permeate, concentrate and storage boundaries on the real RO plant
The rack, high-pressure pump, online flow instruments and product/concentrate tanks put rate and inventory in one balance.
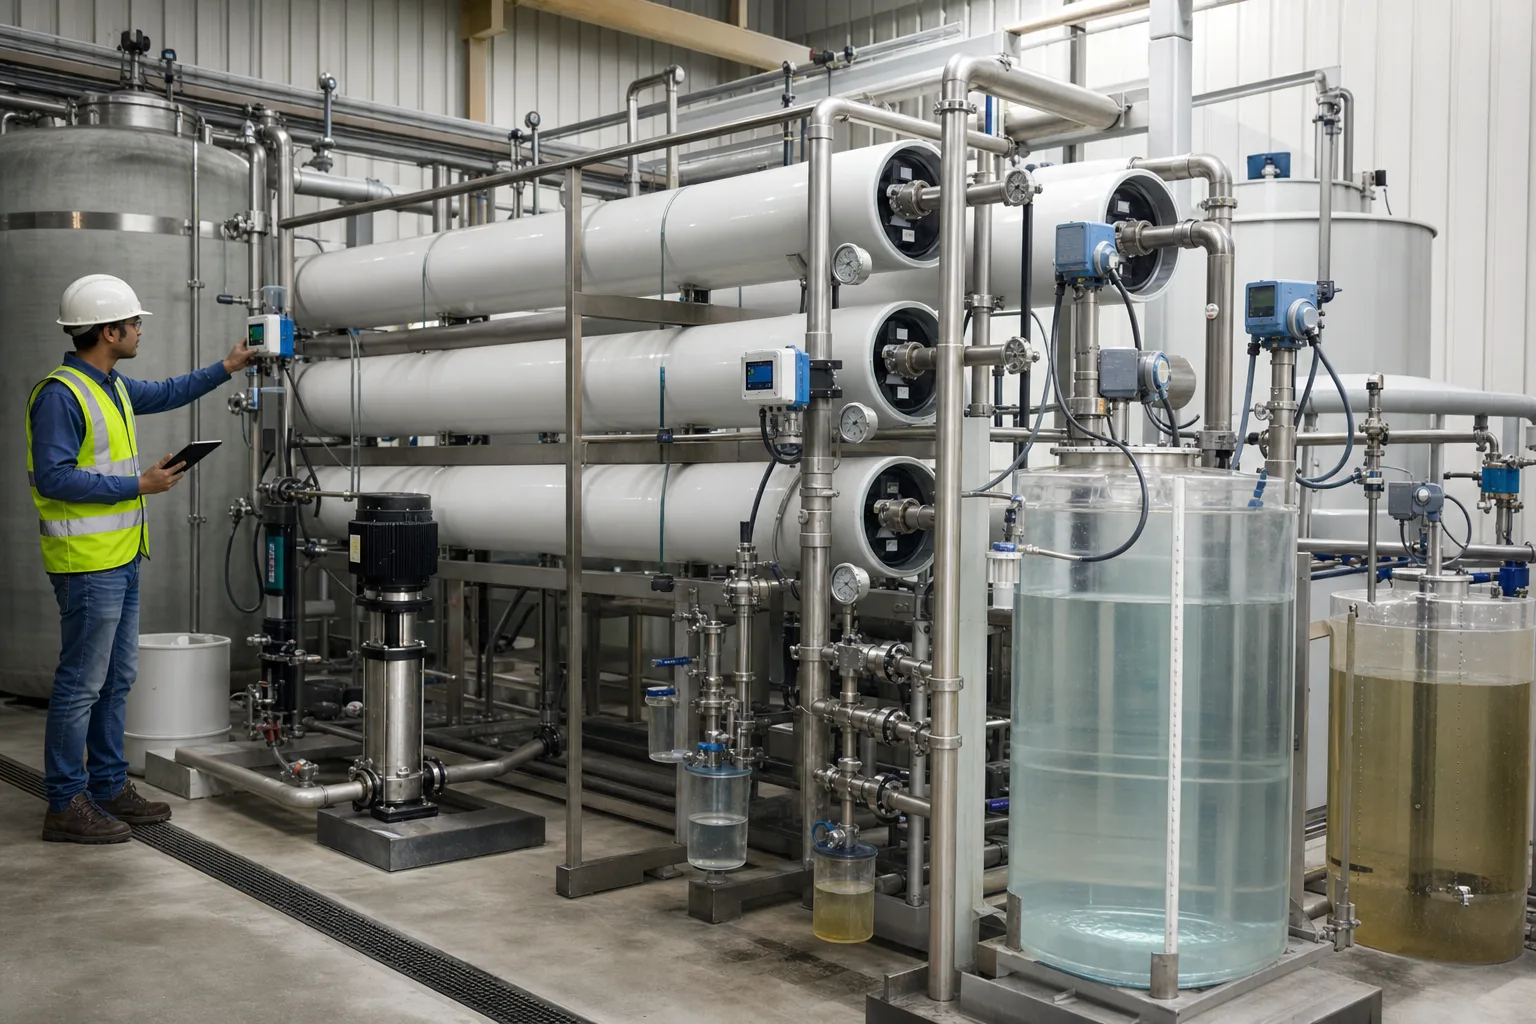 11RO feed Qf and high-pressure pump22Permeate Qp and product tank33Concentrate Qc and brine tank44Meters, levels and sample side flows
What to identify
- 1RO feed Qf and high-pressure pump
- 2Permeate Qp and product tank
- 3Concentrate Qc and brine tank
- 4Meters, levels and sample side flows
What the image proves
Steady RO has one main inlet and two outlets; tanks, flushes, sampling, drains and recycle add ΔV and auxiliary terms.
How to verify it
Number every stream on a P&ID-like sketch and read totalizers plus tank levels at the same start/end times.
Bench mass conservation shows that removed water does not remove all salt
A measured feed divides through a small membrane cell into clear permeate and darker concentrate, with cylinders, scales and salt samples.
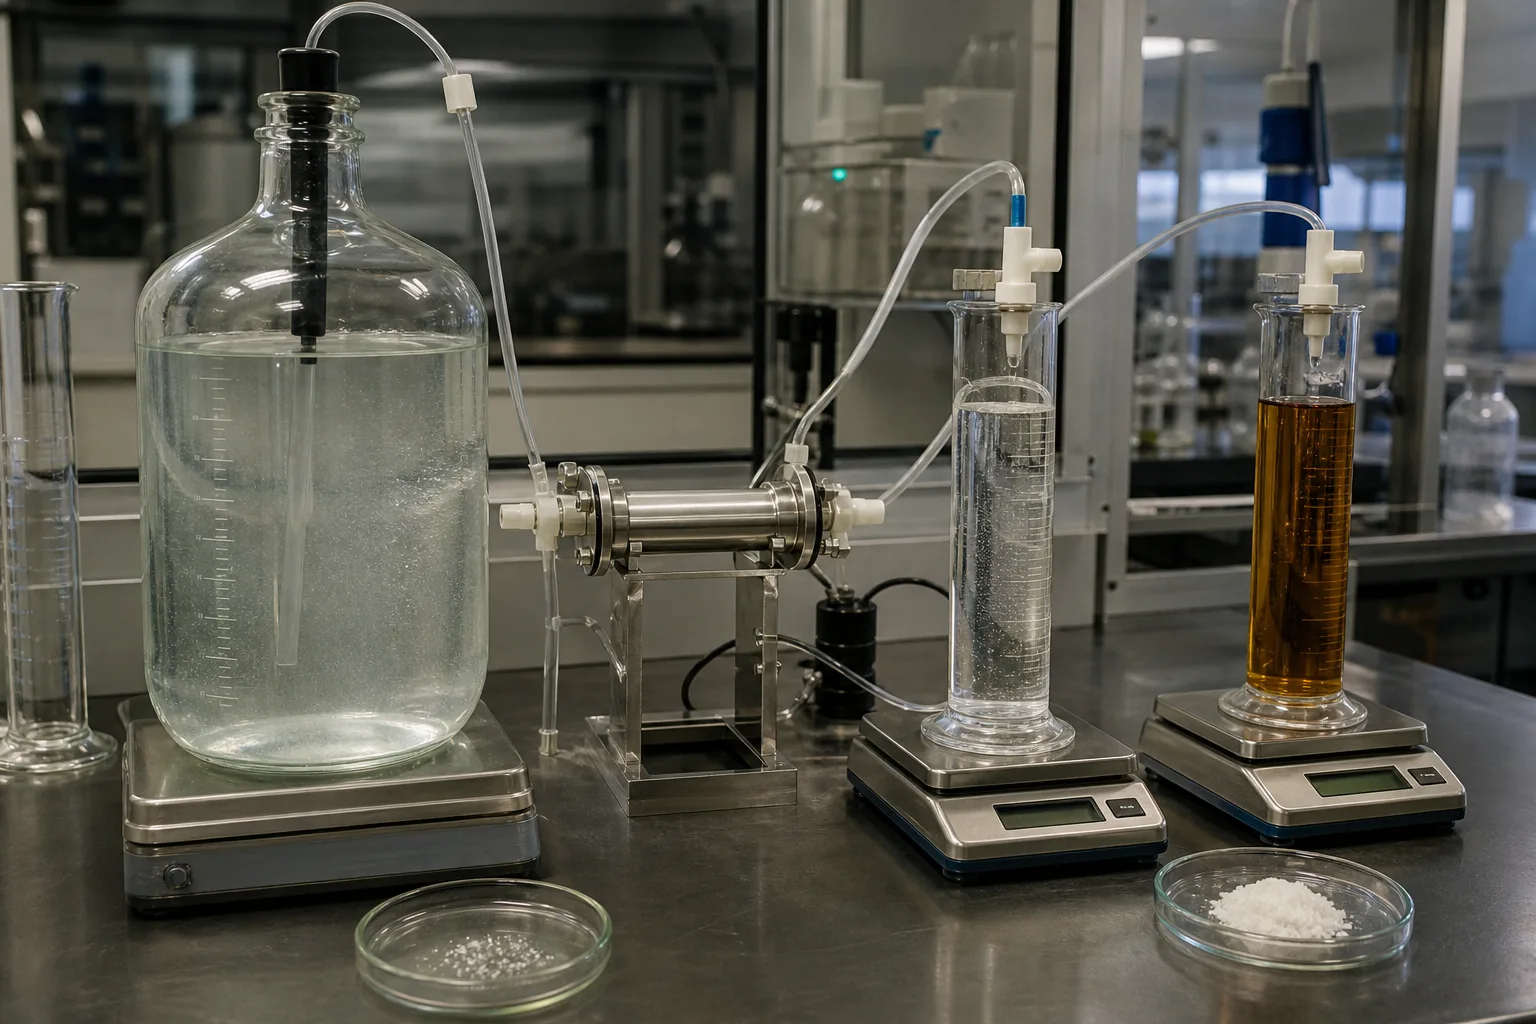 11Initial Vf and Cf22Membrane control boundary33Permeate Vp and Cp44Remaining Vc and Cc
What to identify
- 1Initial Vf and Cf
- 2Membrane control boundary
- 3Permeate Vp and Cp
- 4Remaining Vc and Cc
What the image proves
Batch water balance is Vf=Vp+Vc; conservative solute balance is VfCf=VpCp+VcCc.
How to verify it
Measure all three volumes/masses and one species. Missing salt points to precipitation, adsorption, sampling, hold-up or analysis.
A transparent continuous pilot synchronizes Qf, Qp, Qc and three quality points
Feed tank and pump supply a clear pressure vessel while separate receivers and sensors identify all streams.
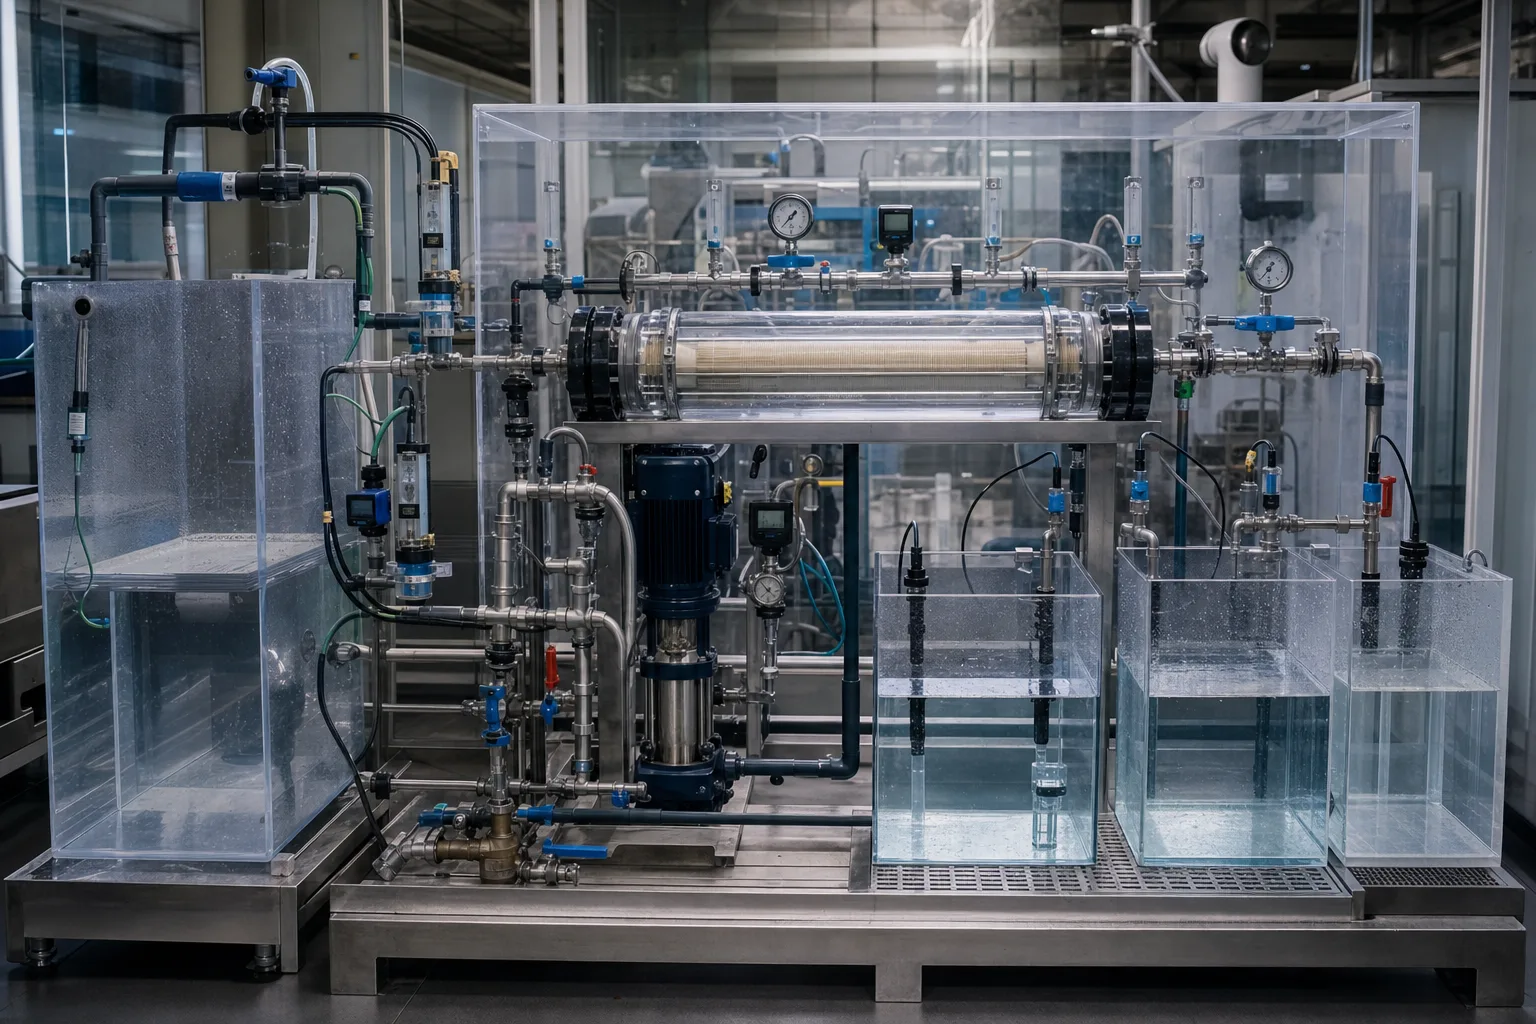 11Feed tank Qf/Cf22Membrane and operating pressure33Permeate Qp/Cp44Concentrate Qc/Cc
What to identify
- 1Feed tank Qf/Cf
- 2Membrane and operating pressure
- 3Permeate Qp/Cp
- 4Concentrate Qc/Cc
What the image proves
Recovery Y=Qp/Qf and salt rejection are different metrics; both permeate and concentrate matter.
How to verify it
Wait for stable pressure, flows, conductivities and level slopes; close water and Q×C balances with simultaneous samples.
Three rigs show that high recovery, normal recovery and hidden loss can look alike
Independent loop inventories and side hoses differ; abnormal foaming or drainage exposes a missing stream/nonsteady state.
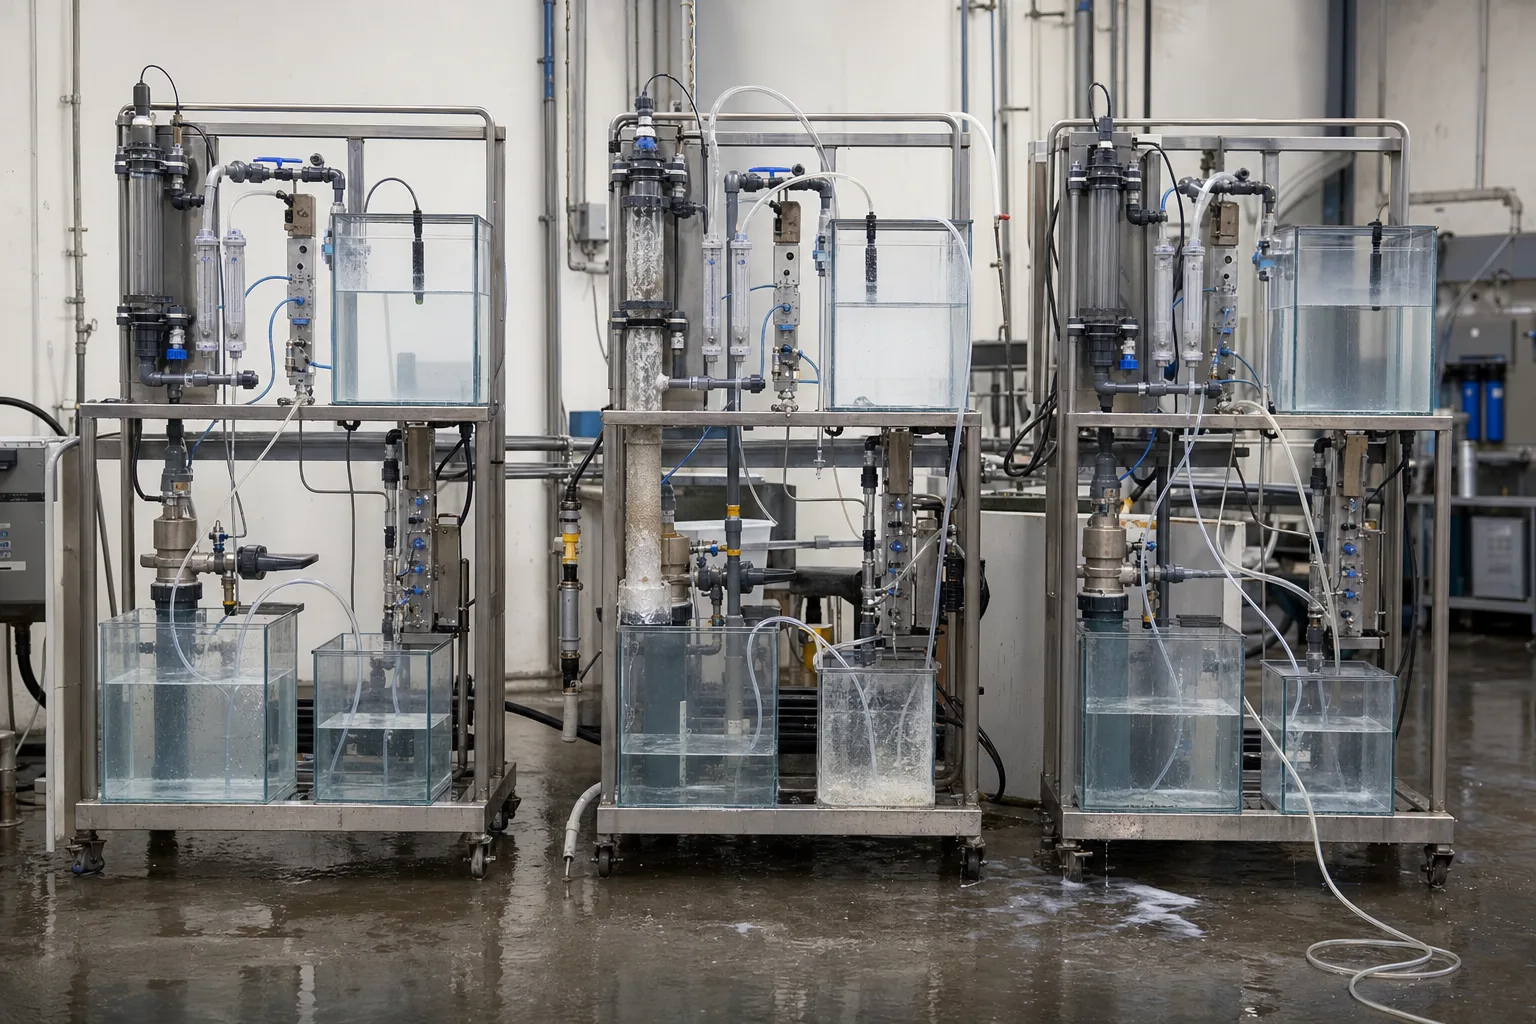 11Lower recovery: larger concentrate22Hidden side flow/leak/nonsteady state33Higher recovery: smaller concentrate44Independent boundaries and storage
What to identify
- 1Lower recovery: larger concentrate
- 2Hidden side flow/leak/nonsteady state
- 3Higher recovery: smaller concentrate
- 4Independent boundaries and storage
What the image proves
Recovery is comparable only for the same boundary and period. Small visible brine can also be a meter or inventory error.
How to verify it
Trace valves, hoses, drains, flush, samples and seal leaks; validate online totals against tank-volume change.
Field reconciliation checks meters, levels, drains and samples together
Engineers read flow and tank level, capture leakage and use portable analysis on the three streams.
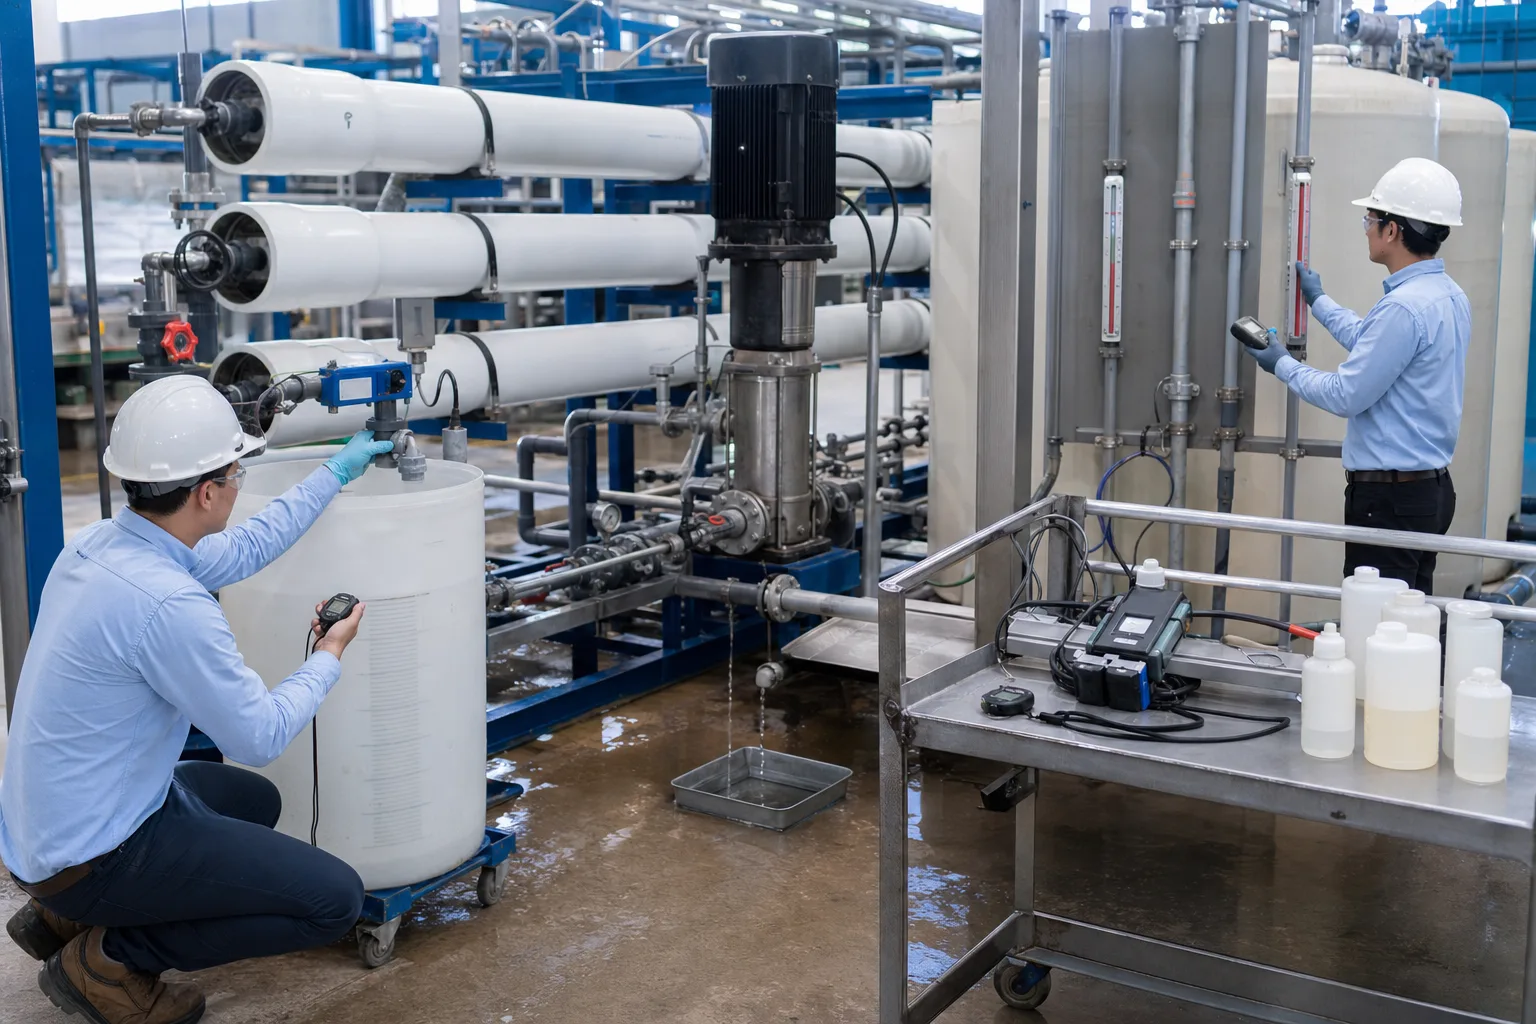 11Feed/permeate/concentrate meters22Tank level-volume change33Leak, flush and drain loss44Three samples and compensated quality
What to identify
- 1Feed/permeate/concentrate meters
- 2Tank level-volume change
- 3Leak, flush and drain loss
- 4Three samples and compensated quality
What the image proves
A credible account closes water and a suitable conservative solute and explains the residual.
How to verify it
Calibrate or clamp-check key meters, time a volume test, measure starting/ending levels and collect visible drains; investigate rather than allocate residual away.
Nine steps from boundary to accepted closure
Keep the same control volume, period and units.
1. Boundary
element/stage/pass/system/plant
Classify crossing and internal recycle.
2. Streams
feed/product/brine/flush/sample/drain/leak/reuse
Avoid a three-meter-only account.
3. Time
stable snapshot or synchronized Δt
Do not mix operating states.
4. Storage
ΔV=Vend−Vstart
Handle tanks, batch and transients.
5. Water closure
ΣVin−ΣVout−ΔV=residual
Test boundary and metering.
6. Recovery
qualified product/fresh feed
Name stage, pass, system or plant Y.
7. Solute balance
Σ(V×C)in−Σ(V×C)out−ΔM
Find passage, source or sink.
8. Concentration
observed Cc/Cf; ideal 1/(1−Y)
Interpret departures.
9. Uncertainty
accuracy+sampling+temperature+closure+outcome
Make the result reproducible and safe.
Four commonly confused metrics
Write numerator, denominator and boundary.
Water balance
- Definition
- ΣQin−ΣQout=dV/dt; cumulative form includes inventory.
- Does not prove
- Closure alone does not prove quality or each meter's accuracy.
- Use
- Find missing flow, duplicate recycle, meter bias and transient storage.
Water recovery Y
- Definition
- Qualified product/fresh feed for the named boundary.
- Does not prove
- Not salt rejection or automatically plant net reuse.
- Use
- Quantify product-water fraction with brine and risk.
Salt rejection/passage
- Definition
- Often R=1−Cp/Cf; state the feed concentration basis.
- Does not prove
- Cannot replace Y; high rejection says nothing about brine volume.
- Use
- Assess membrane ion separation after normalization.
Concentration factor
- Definition
- Observed species Cc/Cf; ideal volume CF≈1/(1−Y).
- Does not prove
- Not every ion equals conductivity ratio when passage/reaction occurs.
- Use
- Estimate osmotic/scaling load and verify by solute balance.
For two series stages where stage 2 treats only stage-1 concentrate with no other stream, Ytotal=1−(1−Y₁)(1−Y₂). Two 50% stages give 75%, not 100%. Redraw the overall boundary if interstage recycle, bypass or a second pass changes the topology.
Retain four raw evidence sets
Boundary/time
Numbered flow diagram, valve/recycle state, stability criterion, start/end and flush events.
Water quantity
Instantaneous and totalized flows, calibration/range, tank level-volume curve, leaks and collected drains.
Water quality
Simultaneous samples, compensated conductivity, TDS/target ion, pH, precipitation and method limits.
Operating result
Last-stage flow/ΔP, normalized permeate/salt passage, osmotic/scaling prediction, CIP and compliant yield.
Four closure conflicts
- Signal
- Qf exceeds Qp+Qc while level rises or flushing occurs
- Likely cause
- Transient storage or omitted auxiliary flow
- First action
- Use synchronized totals and add ΔV/flush/sample/leak
- Signal
- Water closes but solute mass disappears with turbidity/scale
- Likely cause
- Precipitation, adsorption or analysis bias
- First action
- Check scale, filtered/dissolved ions, pH/T and deposit
- Signal
- High Y with low last-stage flow and high brine EC/ΔP
- Likely cause
- Real concentration near hydraulic/scaling limit
- First action
- Check design, scaling, minimum concentrate flow and normalized data
- Signal
- Flow recovery stable but EC ratio differs from 1/(1−Y)
- Likely cause
- Passage, compensation/composition, dosing or nonconservative EC
- First action
- Use a specific conservative ion and exact Q×C balance
Four misconceptions
75% recovery means a 1.75 concentration factor
Ideal CF is 1/(1−0.75)=4; recovery is removed-water fraction, CF is inverse remaining fraction.
Stage recoveries add
A downstream stage treats the upstream remainder; multiply remaining fractions or redraw a complex boundary.
Conductivity ratio is exact salt concentration
Temperature, composition, ion activity, passage, precipitation and dosing alter it.
Higher recovery is always better
It raises concentration, osmotic pressure, scaling and terminal low-flow risk; optimize safe compliant lifecycle cost.