Illustrated guide · Operating diagnostics
What does rising RO stage differential pressure usually mean?
Trace rising stage ΔP from feed-spacer restriction through location patterns, flow/viscosity correction, pressure-tap QA and deposit evidence.
Direct answer
Direct answer
RO stage differential pressure is normally stage feed pressure minus stage concentrate pressure. It primarily measures hydraulic resistance along feed headers, vessels and spiral-wound feed-spacer channels; it is not transmembrane pressure and does not directly measure salt rejection. A sustained increase at the same or corrected feed/concentrate flow and temperature usually means that effective channel area has narrowed or roughness has increased because of particles/colloids, biofilm and organics, precipitated scale, debris, or—when severe—element deformation/telescoping or a local pipe/valve restriction. Higher flow, colder more viscous water, valve changes, plugged pressure taps or gauge drift can also create an apparent increase, while lower flow can hide real plugging. Measure every stage, correct for hydraulic conditions and compare with a clean stable baseline. A first-stage rise often directs attention to pretreatment breakthrough, particulate/colloidal or early biological fouling; a last-stage rise favors concentration-zone scaling/precipitation or inadequate tail crossflow; a simultaneous step across stages first calls for common flow, valve, header and instrument checks. Flat ΔP does not prove a clean membrane because surface fouling that mainly reduces permeability may first increase the pressure required to hold output and lower normalized permeate flow. Verify measurement and comparable conditions, localize by stage, identify the material through pretreatment, samples, cleaning return or autopsy, and clean using the membrane supplier/site trigger before compaction and axial mechanical damage make recovery difficult.
Four conditions for a valid ΔP comparison
Flow, viscosity, point location and stage boundary must be aligned.
Measure each stage separately
Whole-train feed-to-concentrate pressure mixes piping, valves, interstage boost and several stages. Taps should be near vessel headers and away from local turbulence.
Hold or correct flow and temperature
Friction varies with flow and viscosity. More crossflow or colder water naturally raises ΔP; turndown can mask plugging.
Separate stage ΔP, feed pressure and NDP
Stage ΔP is axial channel resistance; feed pressure also overcomes osmotic pressure; net driving pressure includes permeate backpressure and osmotic terms.
Validate taps, gauges and valves first
Blocked/crystallized taps, gas, zero drift, units or valve movement can create a false trend. Check independently before cleaning.
Before opening a vessel, use stage gauges and transmitters to prove where ΔP originates
Local gauges span headers, transmitters provide trends and the open vessel end exposes the element inlet and thrust structure.
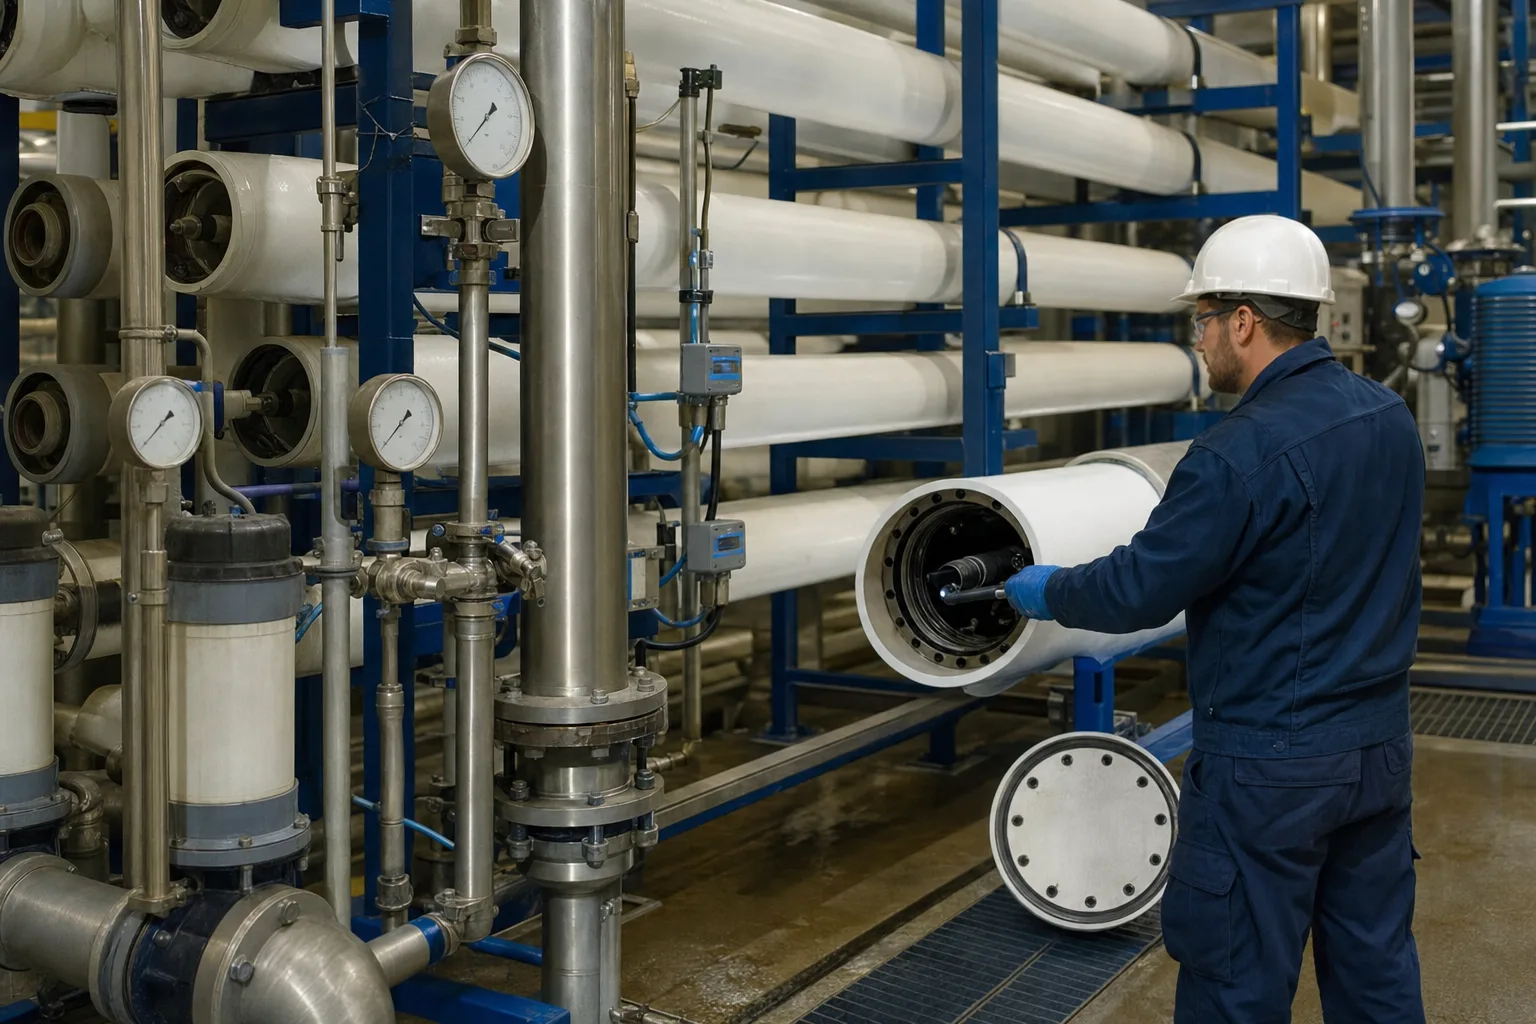 11Stage inlet/outlet mechanical gauges22Pressure transmitters and impulse lines33Pressure vessels and element train44Open inlet end and thrust structure
What to identify
- 1Stage inlet/outlet mechanical gauges
- 2Pressure transmitters and impulse lines
- 3Pressure vessels and element train
- 4Open inlet end and thrust structure
What the image proves
ΔP describes resistance between two named points; if those points straddle a valve, filter or common header, it is not pure membrane-stage pressure drop.
How to verify it
Audit P&ID boundary, units, range and tap location; at matched flow/temperature compare both ends with an independent gauge and inspect taps and isolation valves.
An opened leaf and feed spacer show that rising ΔP begins as a channel-area and roughness problem
Clean white mesh is compared with brown plugged mesh, membrane sheet and a deposit sample.
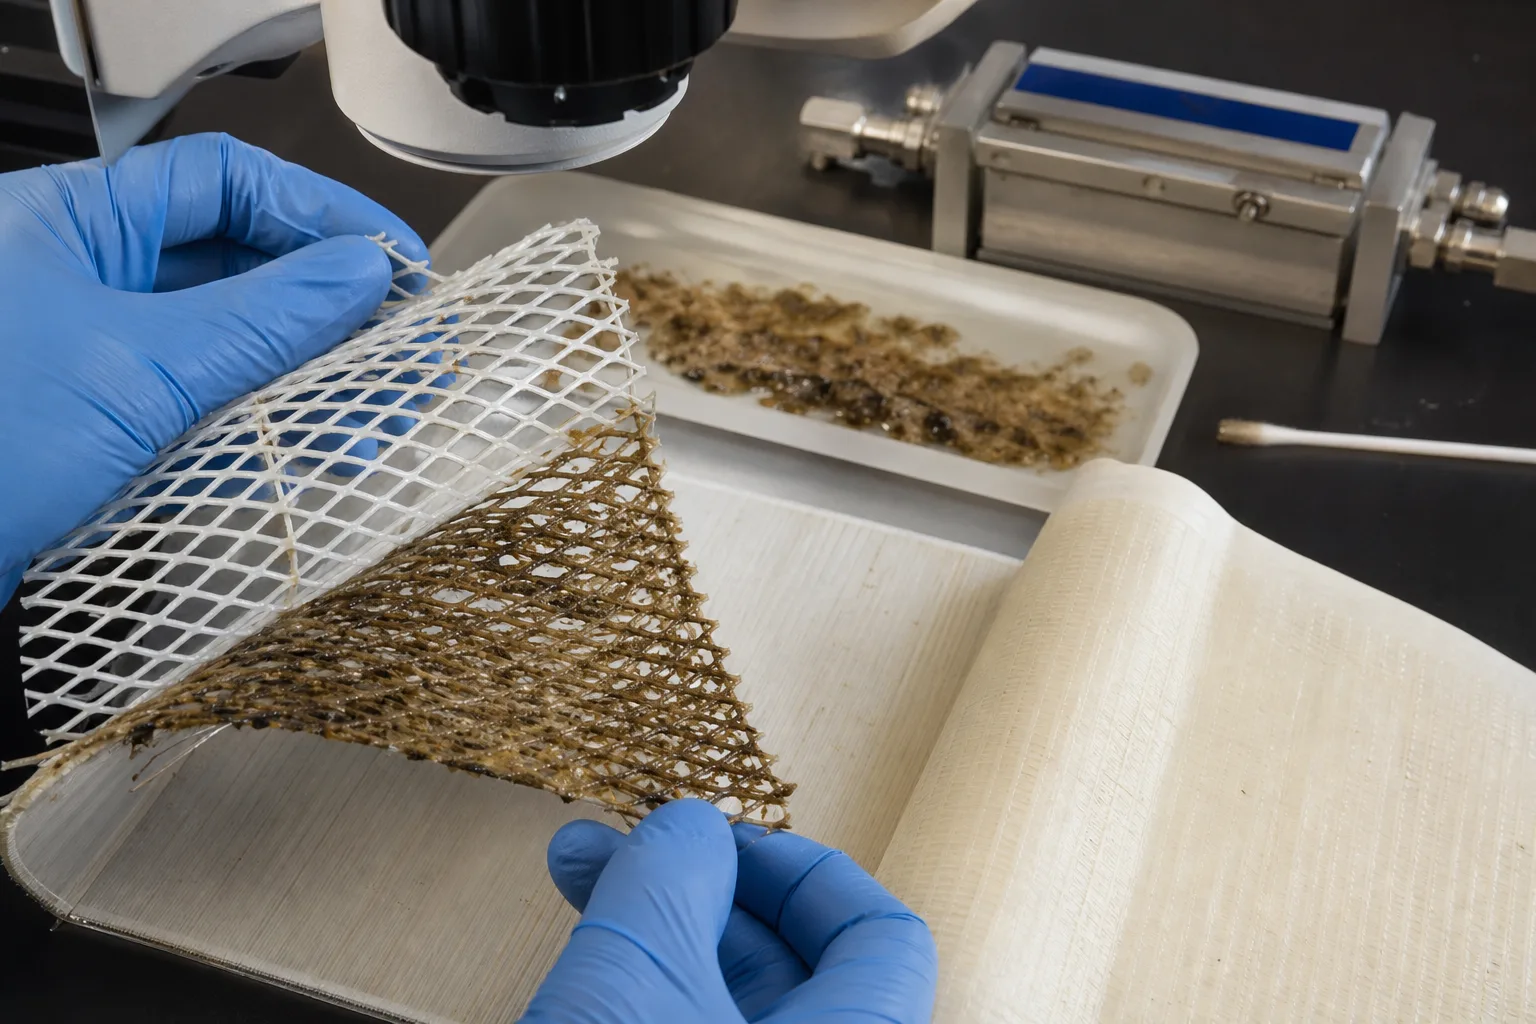 11Open pores in clean feed spacer22Brown plugged spacer and narrowed channel33Membrane surface and selective layer44Scraped deposit for microscopy/chemistry
What to identify
- 1Open pores in clean feed spacer
- 2Brown plugged spacer and narrowed channel
- 3Membrane surface and selective layer
- 4Scraped deposit for microscopy/chemistry
What the image proves
Biofilm, particles or precipitate in spacer openings increases axial friction; surface coverage that has not blocked channels may reduce normalized flow before ΔP moves.
How to verify it
Preserve inlet/middle/outlet spacer, sheet and deposits; correlate microscopy, biological, elemental/mineral and organic results with stage location and CIP return.
Parallel transparent vessels compare clean and plugged channels at equal flow
The clean upper channel has lower inlet-to-outlet loss; the dark lower channel has greater loss while samples show that hydraulic and quality evidence are separate.
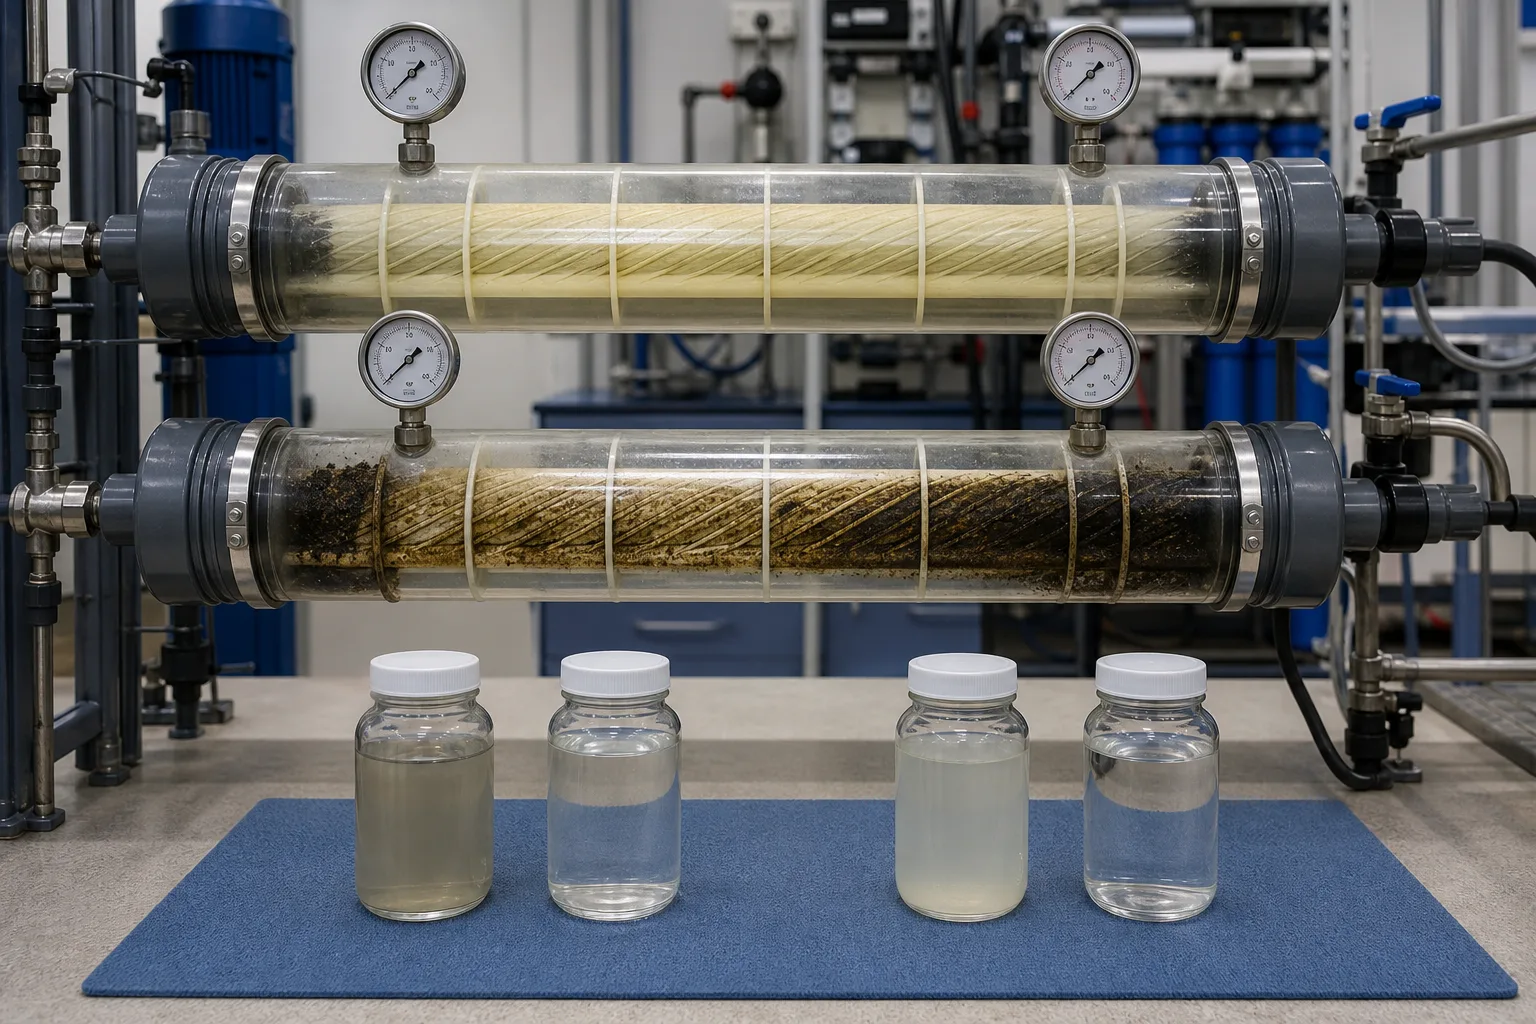 11Clean-channel inlet/outlet pressure pair22Plugged-channel inlet/outlet pressure pair33Matched feed and concentrate flow44Stream samples and quality result
What to identify
- 1Clean-channel inlet/outlet pressure pair
- 2Plugged-channel inlet/outlet pressure pair
- 3Matched feed and concentrate flow
- 4Stream samples and quality result
What the image proves
Only at matched flow, temperature and taps does the difference mainly represent channel resistance. High ΔP need not immediately increase permeate conductivity.
How to verify it
Set equal crossflow/recovery, log four gauges, temperature and flow, close water balance and compare normalized flow/passage separately.
Four autopsies show different foulants behind a similar hydraulic symptom
Brown particulate/organic matter, green biofilm, white mineral scale and fibrous debris are paired with physical samples.
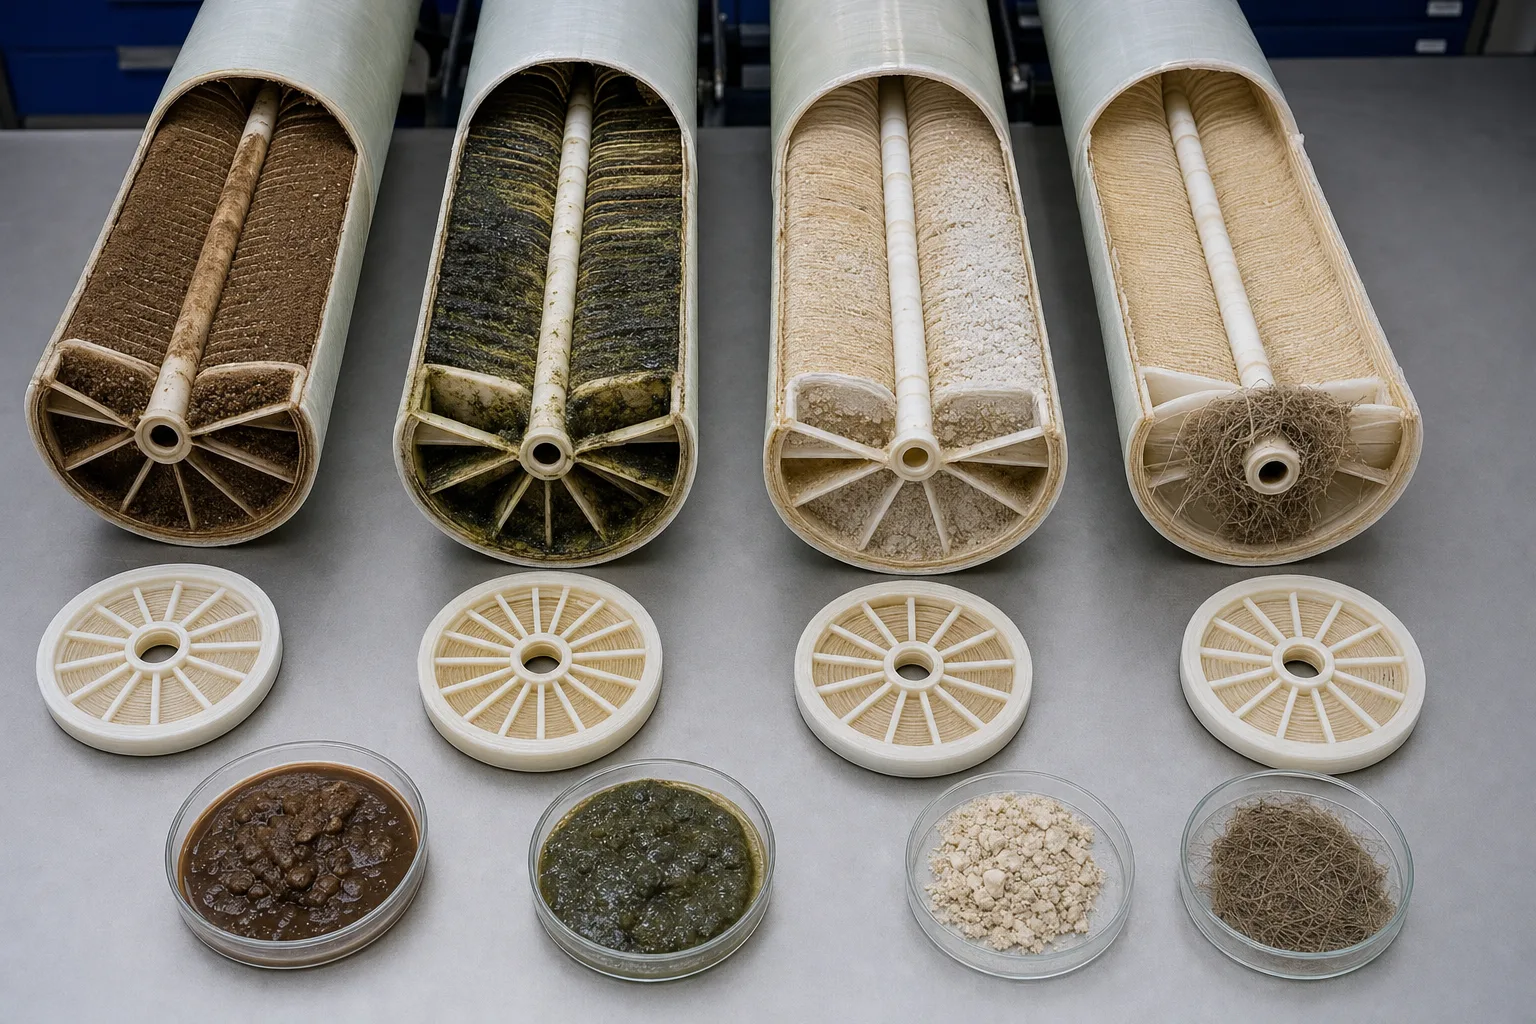 11Brown particulate/colloidal-organic deposit22Green biofilm and EPS33White mineral scale/crystals44Fibers or filter debris in channel
What to identify
- 1Brown particulate/colloidal-organic deposit
- 2Green biofilm and EPS
- 3White mineral scale/crystals
- 4Fibers or filter debris in channel
What the image proves
Rising ΔP proves more hydraulic resistance, not the cleaning chemical. Particles, biology, organics, mineral phases and debris need distinct source control and cleaning.
How to verify it
Map first/last element and feed/concentrate-end distribution, then confirm with microscopy, biological tests, ignition, acid solubility, ICP/SEM-EDS or phase analysis.
Field teardown links trends, end mechanics, clean/dirty elements and guard filtration
Operators check stage gauges and anti-telescoping/thrust parts while clean and fouled elements, a cartridge and deposits sit on the bench.
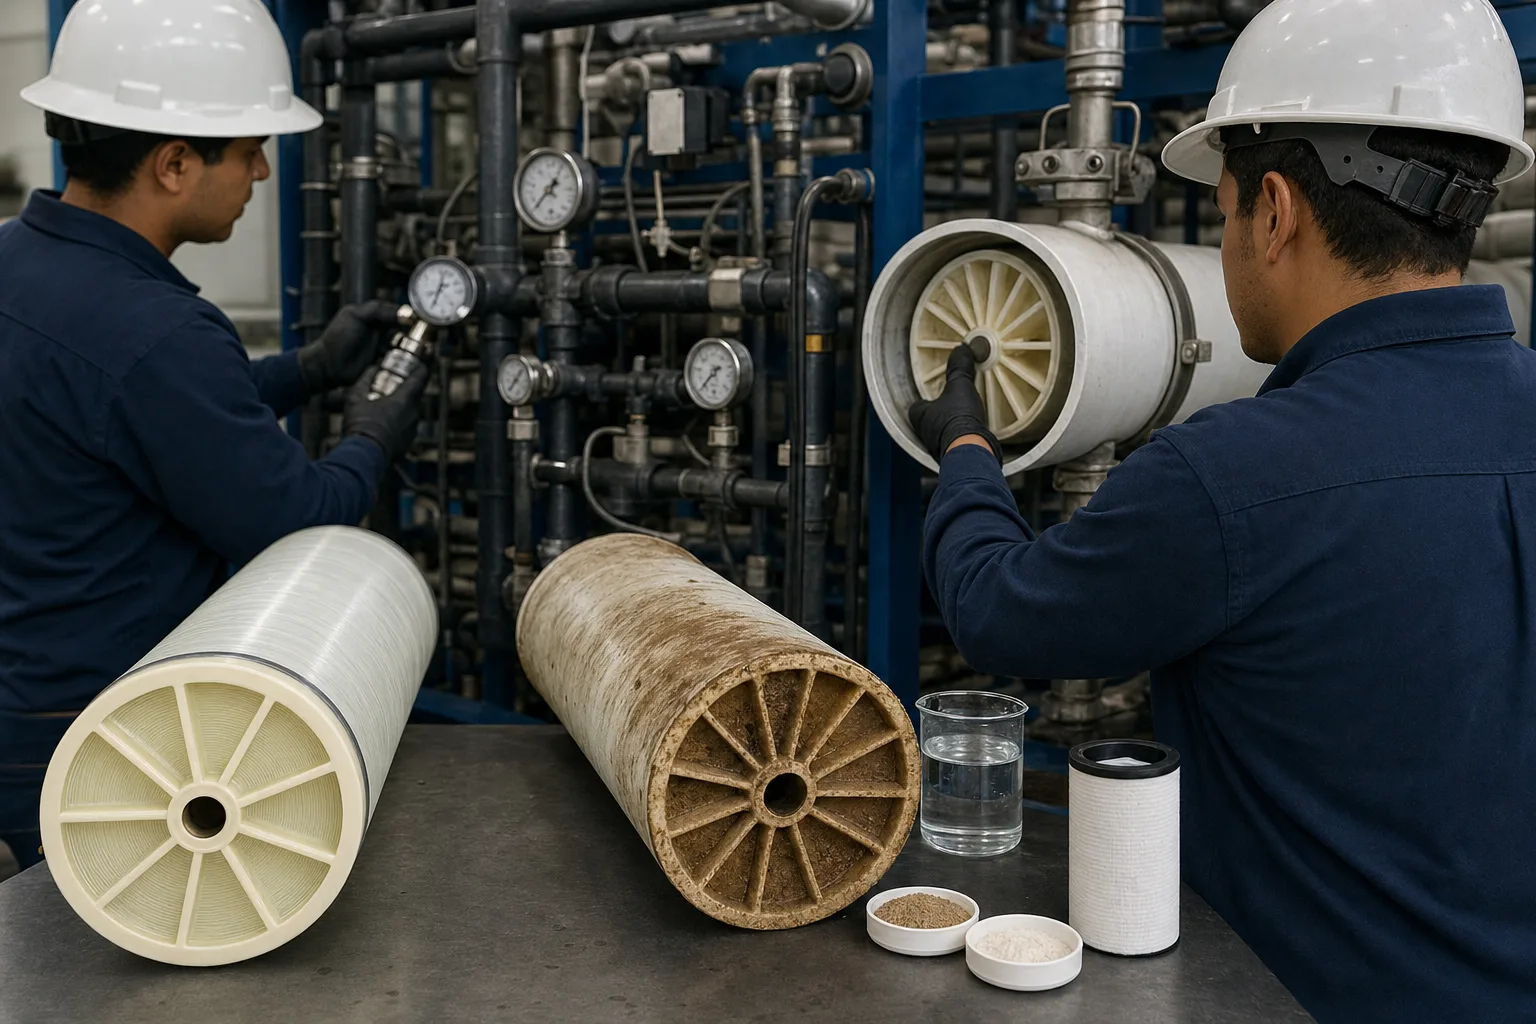 11Stage gauges and common-header state22Adapter, thrust and anti-telescoping parts33Clean versus heavily fouled elements44Guard cartridge, deposit and water evidence
What to identify
- 1Stage gauges and common-header state
- 2Adapter, thrust and anti-telescoping parts
- 3Clean versus heavily fouled elements
- 4Guard cartridge, deposit and water evidence
What the image proves
Long-term high ΔP raises pumping duty and axial force on elements, couplers and thrust parts; severe deformation may not be recoverable by chemistry.
How to verify it
After isolation, depressurization and LOTO inspect length/end-face distortion, connectors, brine seals and thrust ring; align cartridge, SDI, biology and dosing history with ΔP.
Eight steps from ΔP alarm to root cause
Remove operating and measurement explanations before selecting treatment.
1. Define stage
Stage feed P − stage concentrate P
Exclude filter, valve and common-header loss.
2. Validate instruments
Transmitter ↔ local/reference gauge
Eliminate zero, tap, gas, isolation, unit and data errors.
3. Align hydraulics
ΔP + Qf/Qc + T + recovery
Correct flow and viscosity and identify pump/valve effects.
4. Normalize trend
Measured ΔP → clean reference
Compare magnitude, rate and restart response.
5. Localize
First/last/all stages/single vessel
Separate pretreatment, biology, scaling and local mechanics.
6. Combine performance
ΔP + normalized Qp + passage + feed P
Separate channel plugging, permeability and selectivity faults.
7. Identify material
Water/cartridge/CIP/deposit/autopsy
Confirm particles, biology, organics, minerals or debris.
8. Correct and verify
Source control + stage CIP/repair → new baseline
Use recovery of ΔP, flow and passage to validate cause.
What different ΔP patterns point toward
Location and rate set the investigation order.
First stage gradually rises
- Common direction
- Pretreatment/guard breakthrough, colloids, particulates, early organic or biofouling.
- Do not miss
- Higher first-stage flow or its tap/valve may mimic it.
- Confirm with
- SDI/turbidity, cartridge DP, biology/ATP, inlet deposits and fixed-flow ΔP.
Last stage gradually rises
- Common direction
- Concentration-zone scale/precipitation, low crossflow or excessive recovery.
- Do not miss
- White is not automatically calcium carbonate; mixed scale is common.
- Confirm with
- Ion saturation, pH/antiscalant, tail flow and mineral/elemental analysis.
All stages step upward
- Common direction
- Flow/temperature change, concentrate valve, common restriction or data fault.
- Do not miss
- Debris, deformation or wrong-direction CIP may also be sudden.
- Confirm with
- Event log, valve/pump state, raw P, independent gauges and common flow.
One vessel/array abnormal
- Common direction
- Local valve/tap, assembly, debris, connector/end distortion or local fouling.
- Do not miss
- Stage average can hide it.
- Confirm with
- Per-vessel P/Q, tracer/local test, end inspection and ordered autopsy.
Cleaning triggers and mechanical limits must follow the specific element, vessel and system design. A generic percentage is only a trend reference; it does not replace the clean baseline, flow correction and supplier safety limits.
Synchronize four data sets
Stage pressures
Raw inlet/outlet P, vessel outliers, tap/valve state, transmitter-versus-gauge error and units.
Hydraulics
Feed/concentrate flow, stage recovery, temperature/viscosity, VFD, concentrate valve, bypass and flush.
Pretreatment/chemistry
Turbidity/SDI, cartridge DP, biology, organics, hardness/silica/sulfate/metals, pH and dosing.
Membrane/action
Normalized flow/passage, trigger, CIP recipe/return, recovery, autopsy location and mechanical damage.
Combine location, rate, flow and material
- Signal
- First-stage ΔP rises slowly and normalized Qp falls
- Likely direction
- Particulate/colloid, organic or biological plugging
- First action
- Check SDI/cartridge/biology; sample and select CIP by material
- Signal
- Last-stage ΔP rises with high recovery/saturation
- Likely direction
- Tail scaling/precipitation or low crossflow
- First action
- Restore design condition, calculate saturation and analyze tail deposit
- Signal
- All stages follow a flow step
- Likely direction
- Operating change, not instant universal fouling
- First action
- Return to matched flow/T and check pump/valve/normalized trend
- Signal
- SCADA ΔP rises but local gauges do not
- Likely direction
- Transmitter, tap, unit or mapping fault
- First action
- Isolate and calibrate data before membrane action
Four misconceptions
High ΔP means high transmembrane pressure
Stage ΔP is axial feed-channel loss; net membrane driving pressure is different.
Rising ΔP means acid-clean immediately
Particles, biofilm, organics and mineral phases require different sequences.
Normal ΔP proves a clean membrane
Permeability loss can lower normalized flow before spacer blockage develops.
Total ΔP replaces stage data
Averages hide first/last-stage and single-vessel hydraulic or mechanical faults.