Illustrated guide · Operating diagnostics
What do pressure, flow and conductivity reveal in an RO system?
Read pressure as driving force and hydraulic resistance, flow as water allocation and membrane loading, and conductivity as ionic allocation—then combine all three through balances and normalized trends.
Direct answer
Direct answer
Pressure shows the hydraulic force supplied by the pump and the head lost through piping, valves and feed spacers; flow shows how feed divides into permeate and concentrate and therefore recovery, flux and crossflow; conductivity is a temperature-dependent proxy for how conductive ions divide among those streams. None is a stand-alone failure verdict. Higher feed pressure may compensate for colder or more saline feed, fouling, greater recovery or permeate backpressure. Lower permeate flow may reflect temperature, salinity, pressure or valve changes rather than membrane loss. Higher permeate conductivity may reflect feed salinity, recovery, pH/CO₂, temperature compensation, a dirty sensor, seal bypass or membrane damage, and it says little about TOC, microbes or particles. Record feed/permeate/concentrate pressure, flow, conductivity, temperature and pH at the same stable condition; first test Qf≈Qp+Qc and, as an ionic approximation at matched temperature, QfCf≈QpCp+QcCc. Then normalize permeate flow, solute passage and pressure drop to reference temperature, salinity, pressure and recovery and compare them with a clean baseline. The useful diagnostic is the combined, calibrated trend—not one instantaneous number.
Four prerequisites for interpreting the signals
Every value needs a known location, stable condition and comparable reference.
Map every pressure point
Feed, stage inlet/outlet, concentrate and permeate pressure answer different questions. Net driving pressure also includes osmotic pressure; pump discharge alone is not membrane resistance.
Close the water split
At steady state without hidden branches, feed should approach permeate plus concentrate. Per-stage permeate, concentrate crossflow and total recovery describe different loads.
Align conductivity temperature and sampling
Conductivity depends on temperature and ion mix. Online, portable and lab readings are not comparable unless compensation, flow state and standards agree.
Normalize stable performance
Temperature, feed salinity, recovery, pressure and permeate backpressure change apparent output and quality; startup or valve transients are not performance baselines.
The control room and RO skid must map pumps, membrane stages, online signals and grab samples
SCADA trends sit in front of the pump and vessel train while local instruments and an operator sample the actual process.
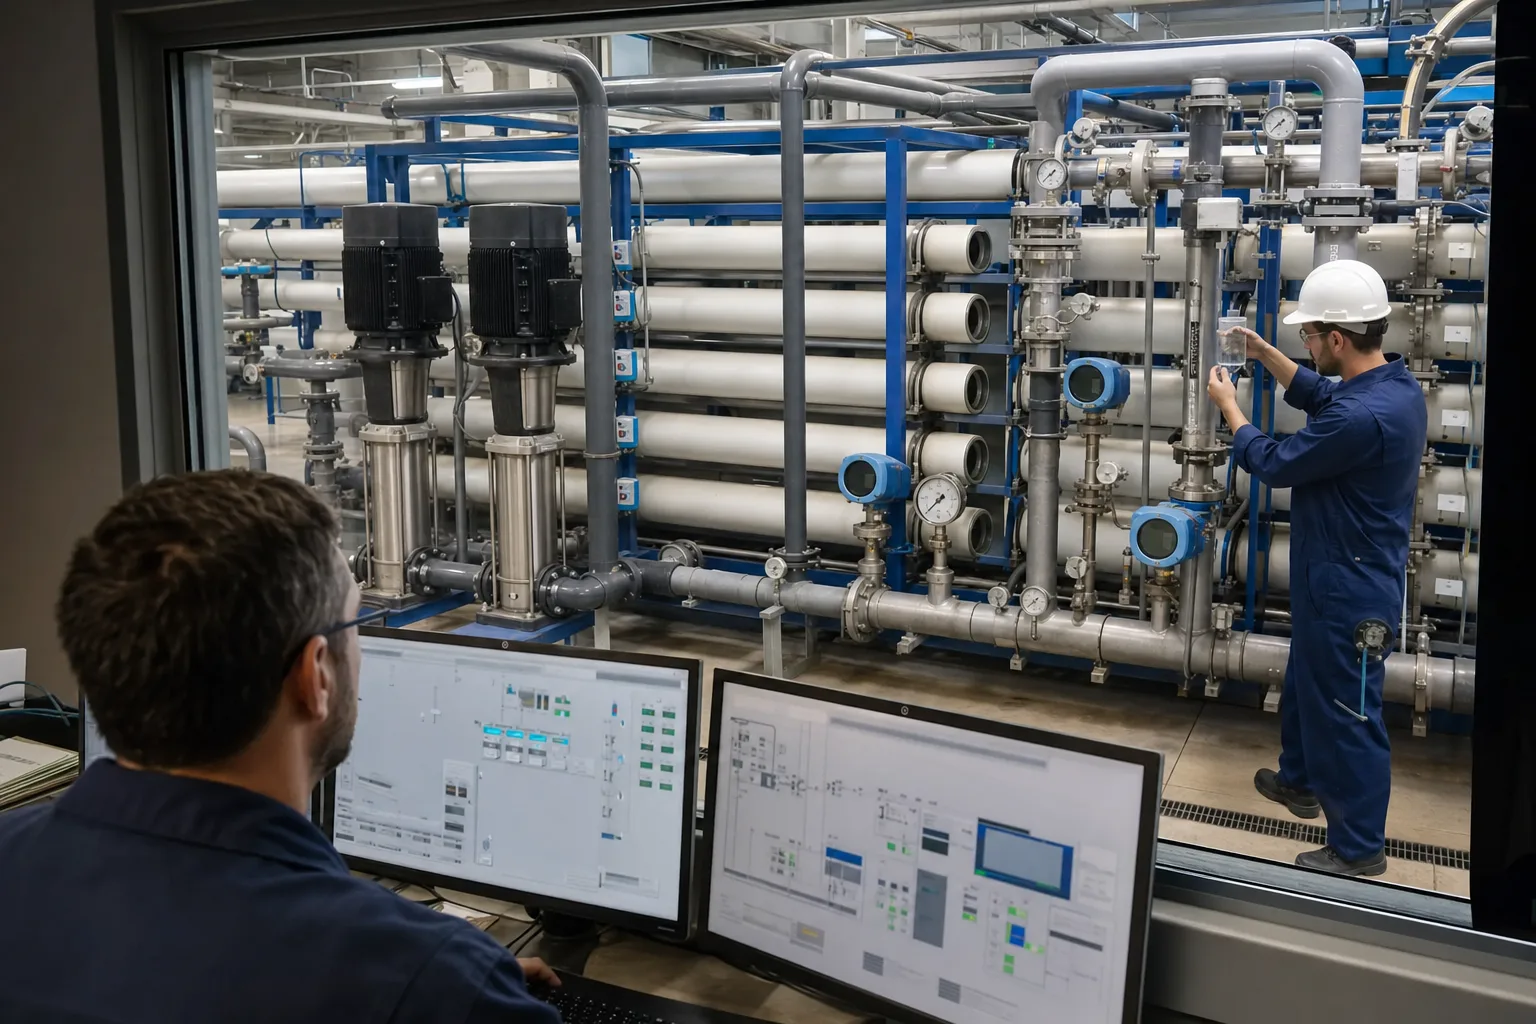 11SCADA trends, alarms and valve/pump state22High-pressure pumps and feed driving force33RO pressure vessels and staged water path44Online instruments and grab-sample check
What to identify
- 1SCADA trends, alarms and valve/pump state
- 2High-pressure pumps and feed driving force
- 3RO pressure vessels and staged water path
- 4Online instruments and grab-sample check
What the image proves
A number becomes useful only after its tag is tied to a physical point; feed and permeate conductivity or pump and concentrate pressure answer different questions.
How to verify it
Audit P&ID, tag, unit, range, orientation, tap location and calibration; compare local indication, portable reference and balances.
Gauges, rotameters and conductivity cells measure force, quantity and ions at one moment
Mechanical gauges span the membrane path, branch rotameters show flow and inline probes are checked against a portable meter and sample.
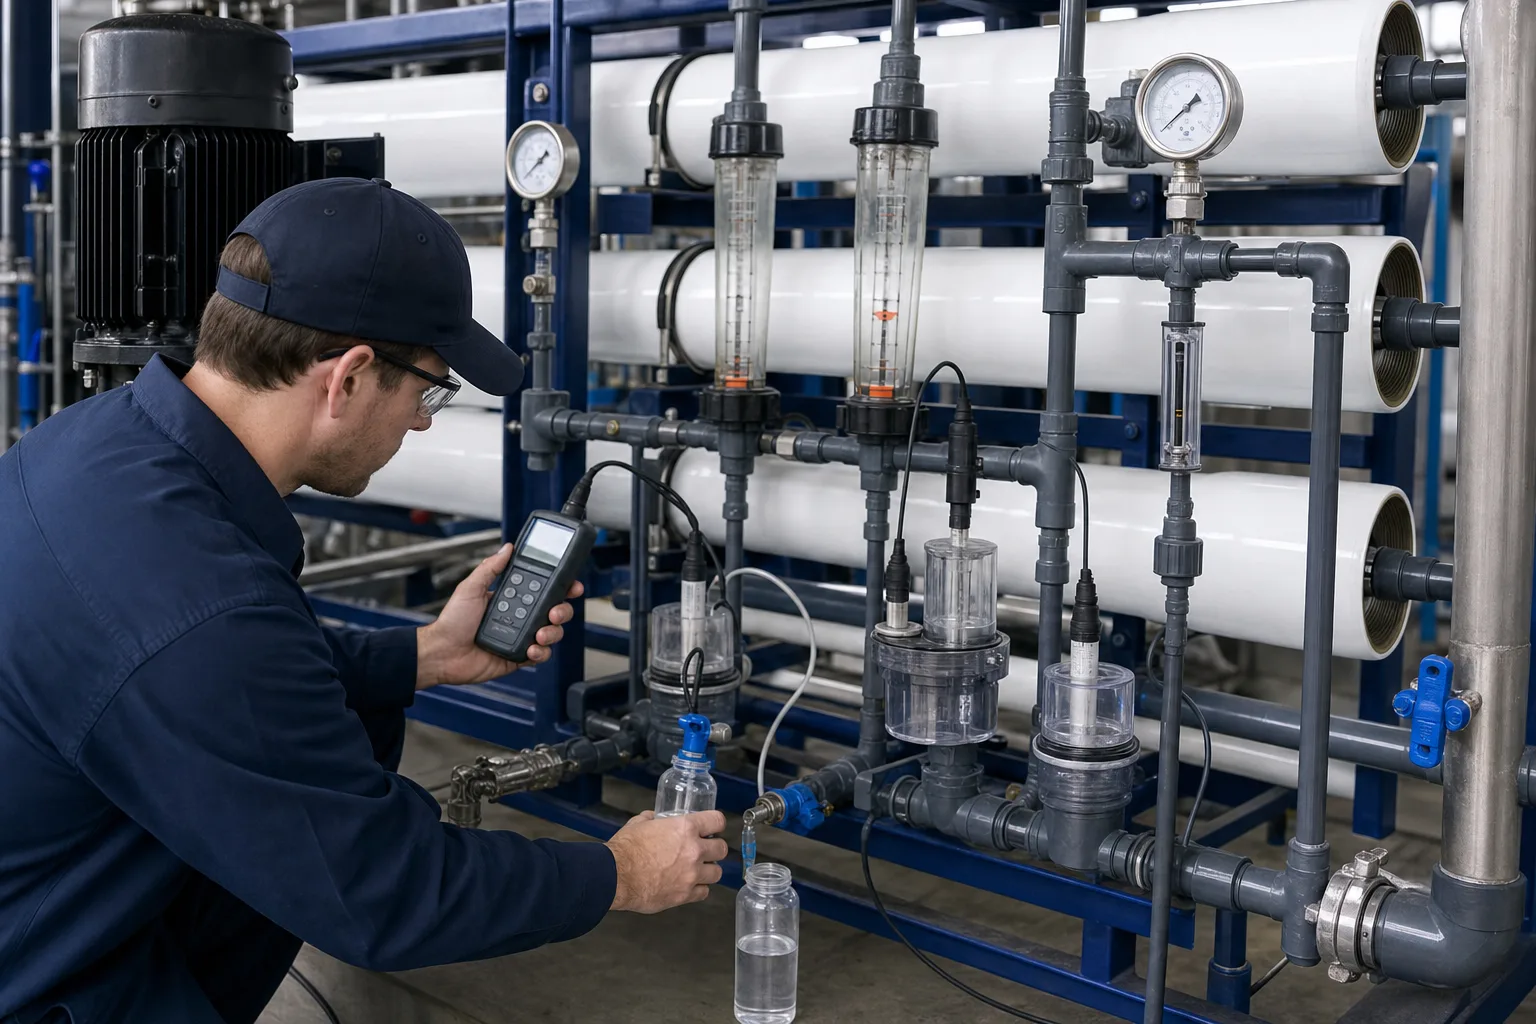 11Stage inlet/outlet pressure gauges22Permeate and concentrate rotameters33Inline conductivity cell and temperature44Portable meter and same-point sample
What to identify
- 1Stage inlet/outlet pressure gauges
- 2Permeate and concentrate rotameters
- 3Inline conductivity cell and temperature
- 4Portable meter and same-point sample
What the image proves
One gauge, meter or cup cannot represent the train; synchronized readings prevent transients from looking like membrane damage.
How to verify it
At stable operation record Qf/Qp/Qc, Pf/Pc/Pp, Cf/Cp/Cc, temperature and pH in the same minute.
A transparent rig turns feed, permeate and concentrate into explicit water and salt balances
Feed pressure/flow, branch rotameters, conductivity points and paired samples expose any inconsistent instrument.
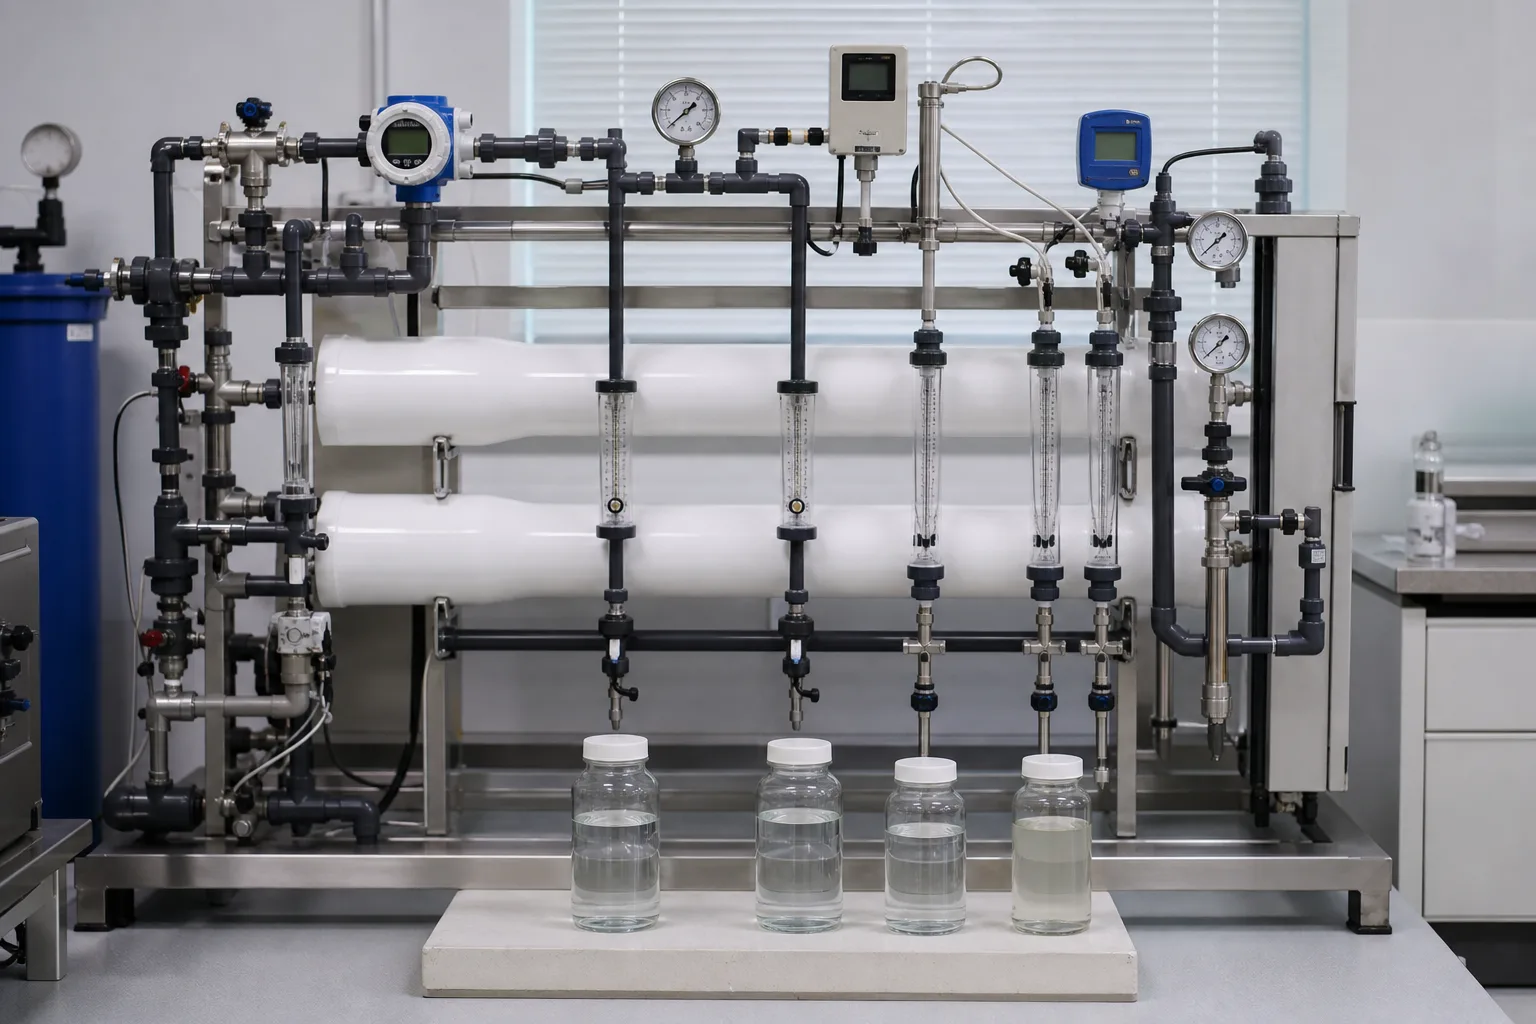 11Feed flow and pressure reference22Permeate/concentrate branch flows33Feed/concentrate pressure and conductivity44Paired samples and balance result
What to identify
- 1Feed flow and pressure reference
- 2Permeate/concentrate branch flows
- 3Feed/concentrate pressure and conductivity
- 4Paired samples and balance result
What the image proves
Qf≈Qp+Qc; matched-temperature conductivity can approximate QfCf≈QpCp+QcCc. Failure to close first points to boundary or measurement, not automatically the membrane.
How to verify it
Align units and compensation, exclude flush/recycle/inventory, then use laboratory ions when chemistry makes conductivity non-linear.
Operators connect trends to gauges, independent conductivity, samples and a fouled element
Pressure transmitters, a portable meter, three stream samples and a removed deposit provide independent evidence.
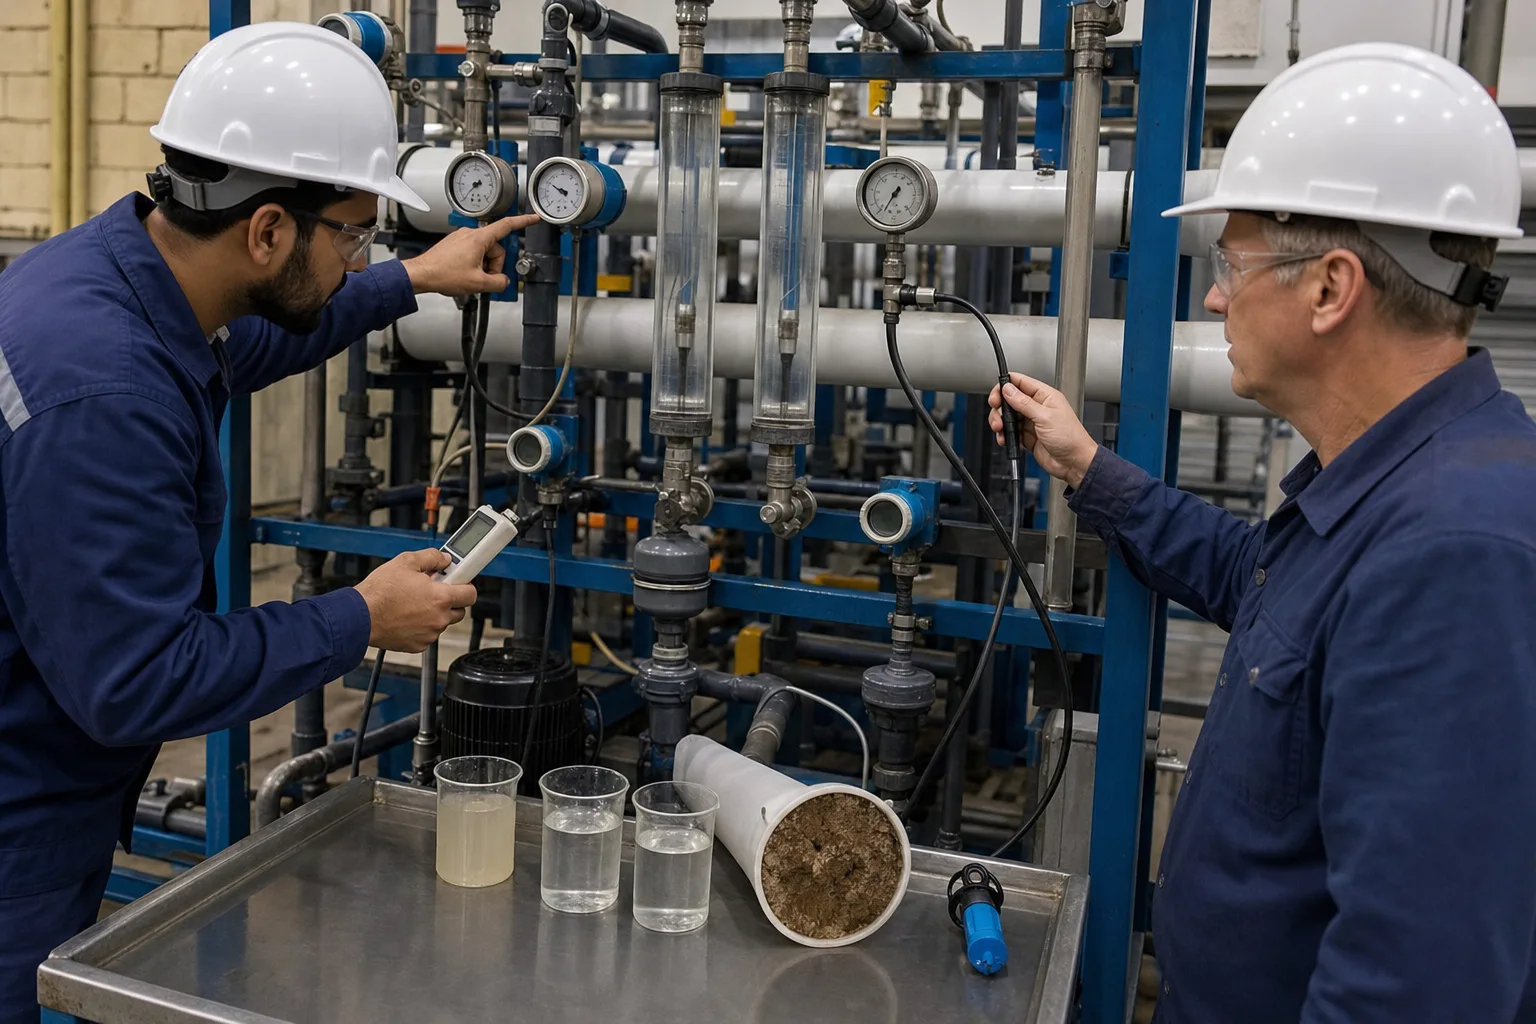 11Gauge/transmitter cross-check22Online versus portable conductivity33Feed, permeate and concentrate samples44Fouled element and deposit evidence
What to identify
- 1Gauge/transmitter cross-check
- 2Online versus portable conductivity
- 3Feed, permeate and concentrate samples
- 4Fouled element and deposit evidence
What the image proves
High pressure, low flow and high conductivity may come from separate faults; cause is credible only when normalized trends, measurement QA and physical evidence agree.
How to verify it
Eliminate sensor drift, plugged taps, unit/temperature errors and bypass first; then localize by stage and confirm with cleaning or autopsy.
The maintenance bench shows that sensors themselves are diagnostic suspects
Portable standards, flow cells, sample lines and removed dirty probes are checked beside operating pressure instruments.
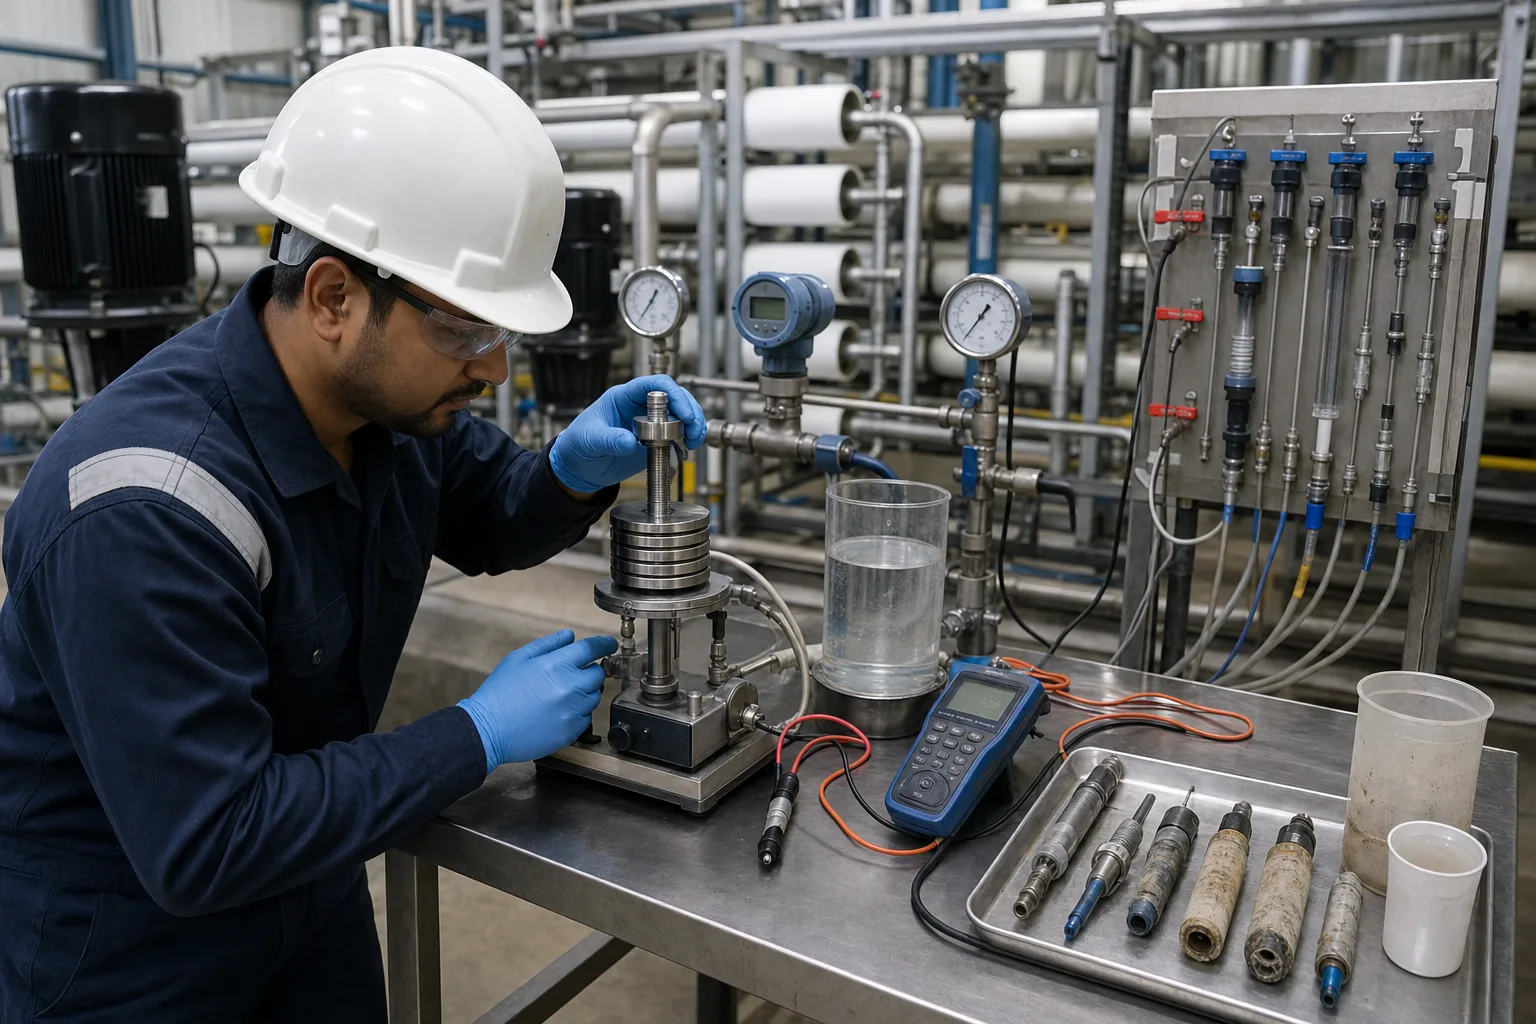 11Operating gauge/transmitter reference22Portable conductivity meter and standard33Flow cell, sampling line and probe set44Fouled or aged pressure/flow/conductivity sensors
What to identify
- 1Operating gauge/transmitter reference
- 2Portable conductivity meter and standard
- 3Flow cell, sampling line and probe set
- 4Fouled or aged pressure/flow/conductivity sensors
What the image proves
Plugged pressure taps, flow zero/span error, bubbles or scale on conductivity cells and failed temperature elements can create a convincing false pattern.
How to verify it
Clean, vent and calibrate zero/span or standards; preserve before/after error and do not treat one portable match as proof of long-term health.
Eight steps from raw readings to a defensible diagnosis
Prove the data are trustworthy and comparable before interpreting membrane condition.
1. Define boundary
Feed → permeate + concentrate
Map bypass, recycle, flush, samples and inventory.
2. Align points
P&ID tag → field device → SCADA
Confirm device, stage, unit and direction.
3. Stabilize
Startup/valve move → stable P-Q-quality
Remove transients and sample lag.
4. Water balance
Qf ≈ Qp + Qc
Expose bypass, leak, level change or flow error.
5. Ionic check
QfCf ≈ QpCp + QcCc
Screen synchronized conductivity; confirm complex chemistry in the lab.
6. Derive metrics
Recovery, stage DP, passage/rejection
Turn points into hydraulic and separation indicators.
7. Normalize
Measured → reference T, salinity, P, recovery
Separate operating conditions from true decline.
8. Converge evidence
Trend → calibration/sample/stage/clean/autopsy
Confirm cause before cleaning or replacement.
What each signal can and cannot prove
A useful signal includes its boundary and required companion evidence.
Pressure and stage DP
- Main meaning
- Pump force, permeate backpressure and hydraulic resistance at fixed flow.
- Cannot prove alone
- High feed pressure alone does not prove blockage.
- Pair with
- Flow, temperature/salinity, stage and permeate pressure, pump/valve state and normalized flow.
Feed/permeate/concentrate flow
- Main meaning
- Water allocation, recovery, flux, crossflow and water balance.
- Cannot prove alone
- Low permeate alone does not prove fouling.
- Pair with
- All three flows, membrane area, P/T, tanks, bypass and normalized flux.
Three-stream conductivity
- Main meaning
- Fast ionic proxy for passage/rejection and approximate salt balance.
- Cannot prove alone
- High permeate conductivity alone does not prove membrane damage.
- Pair with
- Temperature/pH, Cf/Cp/Cc, ions, calibration, location and normalized passage.
Normalized combined trend
- Main meaning
- True changes in flow, passage and DP under reference conditions.
- Cannot prove alone
- Bad inputs can make a precise-looking false trend.
- Pair with
- Clean baseline, stable log, input audit, calibration, stage data and cleaning response.
Conductivity is not an overall water-quality score. It is sensitive to ions but cannot replace TOC, microbial, particle, specific silica/boron or integrity testing required by the product-water use.
Keep four synchronized data sets
Pressure network
Pump suction/discharge, stage inlet/outlet, concentrate and permeate pressure plus valves, VFD and units.
Water split
Feed, stage/total permeate, concentrate, bypass/recycle, tank level and recovery on one basis.
Ions and temperature
Cf/Cp/Cc, sample temperature/compensation, pH and laboratory ions or TDS.
Comparable state
Runtime, flush/CIP, source batch, dosing, temperature, salinity, recovery and normalization version.
How combined signals narrow the cause
- Pattern
- Pf to hold Qp rises; normalized Qp falls; stage DP normal
- Likely direction
- Surface fouling/compaction, T-salinity compensation or permeate backpressure
- First action
- Check T/salinity/Pp, normalize and localize cleaning response
- Pattern
- Feed-to-concentrate DP rises and crossflow is restricted
- Likely direction
- Spacer particulate/biofouling, deposit or pipe/valve restriction
- First action
- Verify stage DP at fixed flow, taps and valves; check pretreatment
- Pattern
- Normalized passage rises with little flow/DP change
- Likely direction
- Seal/interconnector bypass, oxidation/damage or conductivity error
- First action
- Calibrate, sample branches, check pH/CO₂, integrity and end seals
- Pattern
- Water and conductivity balances both fail
- Likely direction
- Meter, compensation, timing, bypass or inventory error
- First action
- Audit points, units, calibration and tank levels before membrane action
Four misconceptions
Higher pressure means dirtier membranes
Salinity, temperature, flow, recovery, valves and permeate backpressure also change pressure.
Lower output means fouling
Normalize temperature, salinity, pressure and recovery and verify the flow meter.
Higher permeate conductivity means a torn membrane
Feed, CO₂/pH, temperature compensation, sensor fouling and seal bypass come first.
Three online values are enough
Location, temperature/pH, stability, calibration, balances, stages and independent samples remain essential.