Illustrated guide · Energy and system control
How does a variable-frequency drive reduce pump energy use?
Use pump and system curves, affinity laws and the load profile to tell genuine VFD savings from simple under-delivery.
Direct answer
Direct answer
A VFD does not create pump efficiency. It changes motor supply frequency/voltage and pump speed so the pump produces only the flow and head demanded, instead of making excess head at constant speed and dissipating it across a throttling valve or recirculating pressurized water through a bypass. For the same centrifugal pump under hydraulically similar conditions, Q₂/Q₁=N₂/N₁, H₂/H₁=(N₂/N₁)² and shaft power P₂/P₁≈(N₂/N₁)³. This can yield large savings in variable-demand, friction-dominated systems. The cube law is not a universal kWh guarantee: the actual point is the intersection of the speed-dependent pump curve and Hsys=Hstatic+KQ². With substantial static head, speed reduction may sharply reduce delivery and provide little valid saving. Include VFD loss, motor cooling, efficiency away from BEP, minimum flow, NPSH/cavitation, resonance, transients, parallel-pump staging and control setpoint. Verify with equal service, measured VFD input kW, Q, suction/discharge head or levels, hours, annual Σ(kW×h), kWh per delivered volume and pressure compliance—not frequency or current alone.
Four boundaries determine the saving
Model the system before crediting the drive.
Does demand vary?
Daily, batch, level or branch variation plus throttling/bypass creates recoverable excess head; fixed duty may not.
Friction or static head?
Friction-dominated curves favor speed control. High lift or minimum process pressure requires point-by-point intersections.
Is the correct service point controlled?
Critical remote pressure, flow or level with setpoint reset avoids holding excessive discharge pressure.
Is the pump group in a safe efficient region?
Check BEP/POR/AOR, minimum flow, NPSH, low-speed cooling, resonance and staging limits.
Treat pumps, drives, valves and running units as one pumping system
A multi-pump station exposes the machines, headers, gauges and control panels needed for a station load baseline.
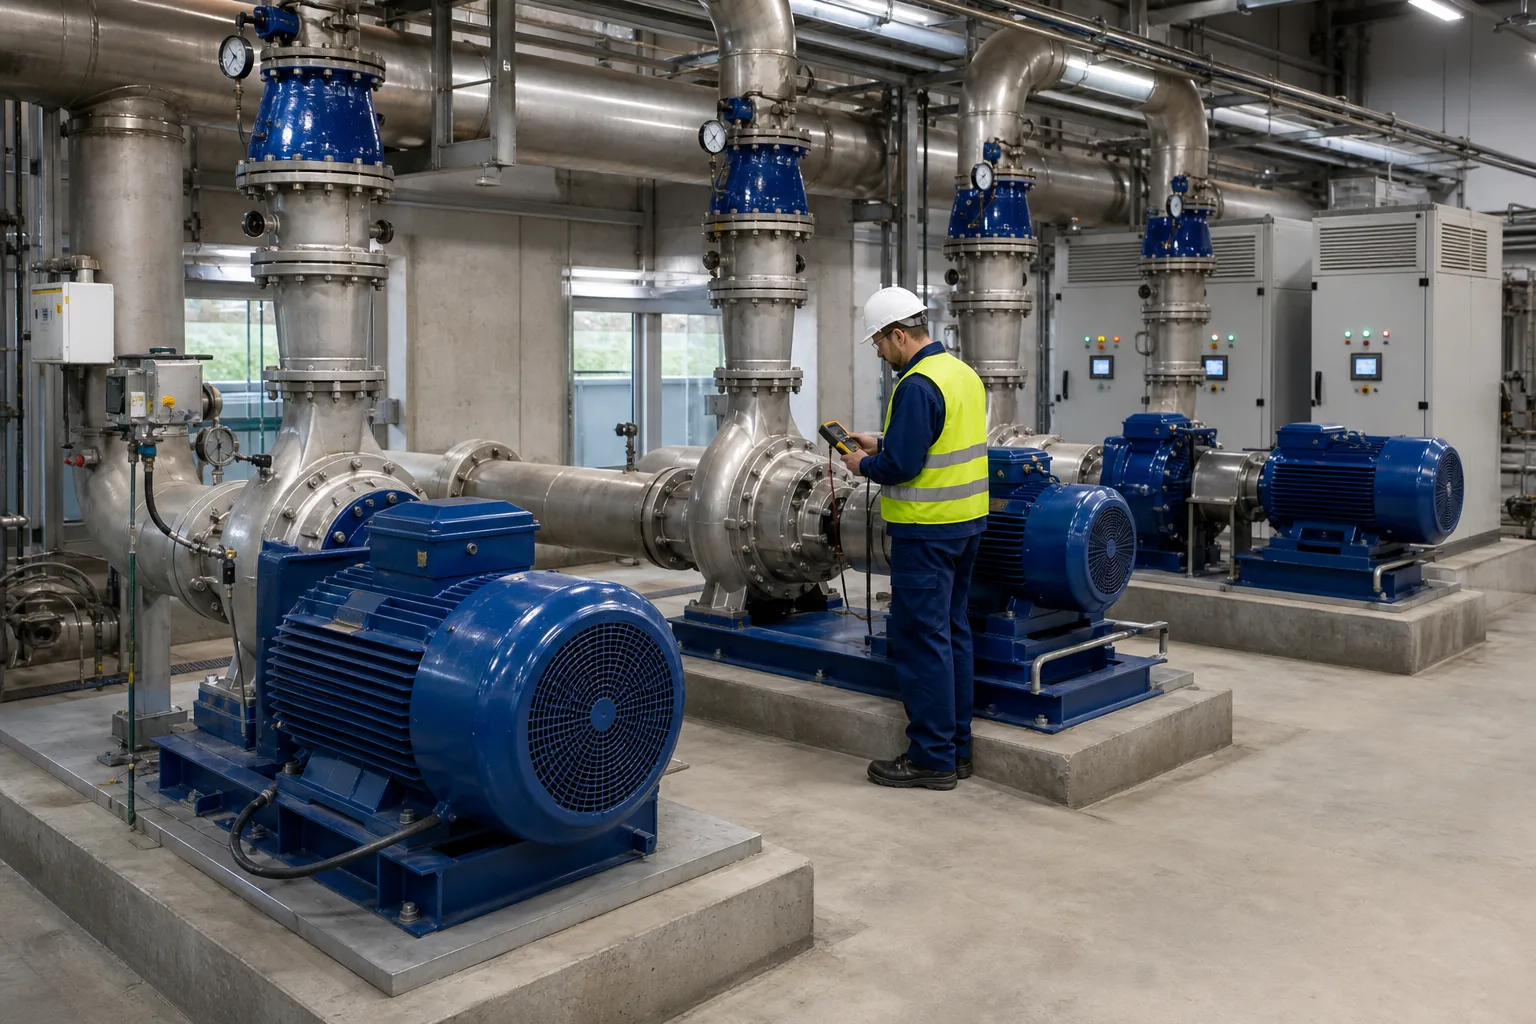 11Parallel centrifugal pumps22Discharge pressure/total head33VFD and power cabinets44Running units and field data
What to identify
- 1Parallel centrifugal pumps
- 2Discharge pressure/total head
- 3VFD and power cabinets
- 4Running units and field data
What the image proves
The saving belongs to the station operating strategy, not an isolated drive.
How to verify it
Trend per-unit run/speed/input kW, total Q, suction/discharge levels, critical pressure and valve/bypass state across the full load range.
A transparent test rig measures frequency, speed, flow, head and power together
A clear pump, tanks, flowmeter, pressure gauges and VFD reveal the real operating point as speed changes.
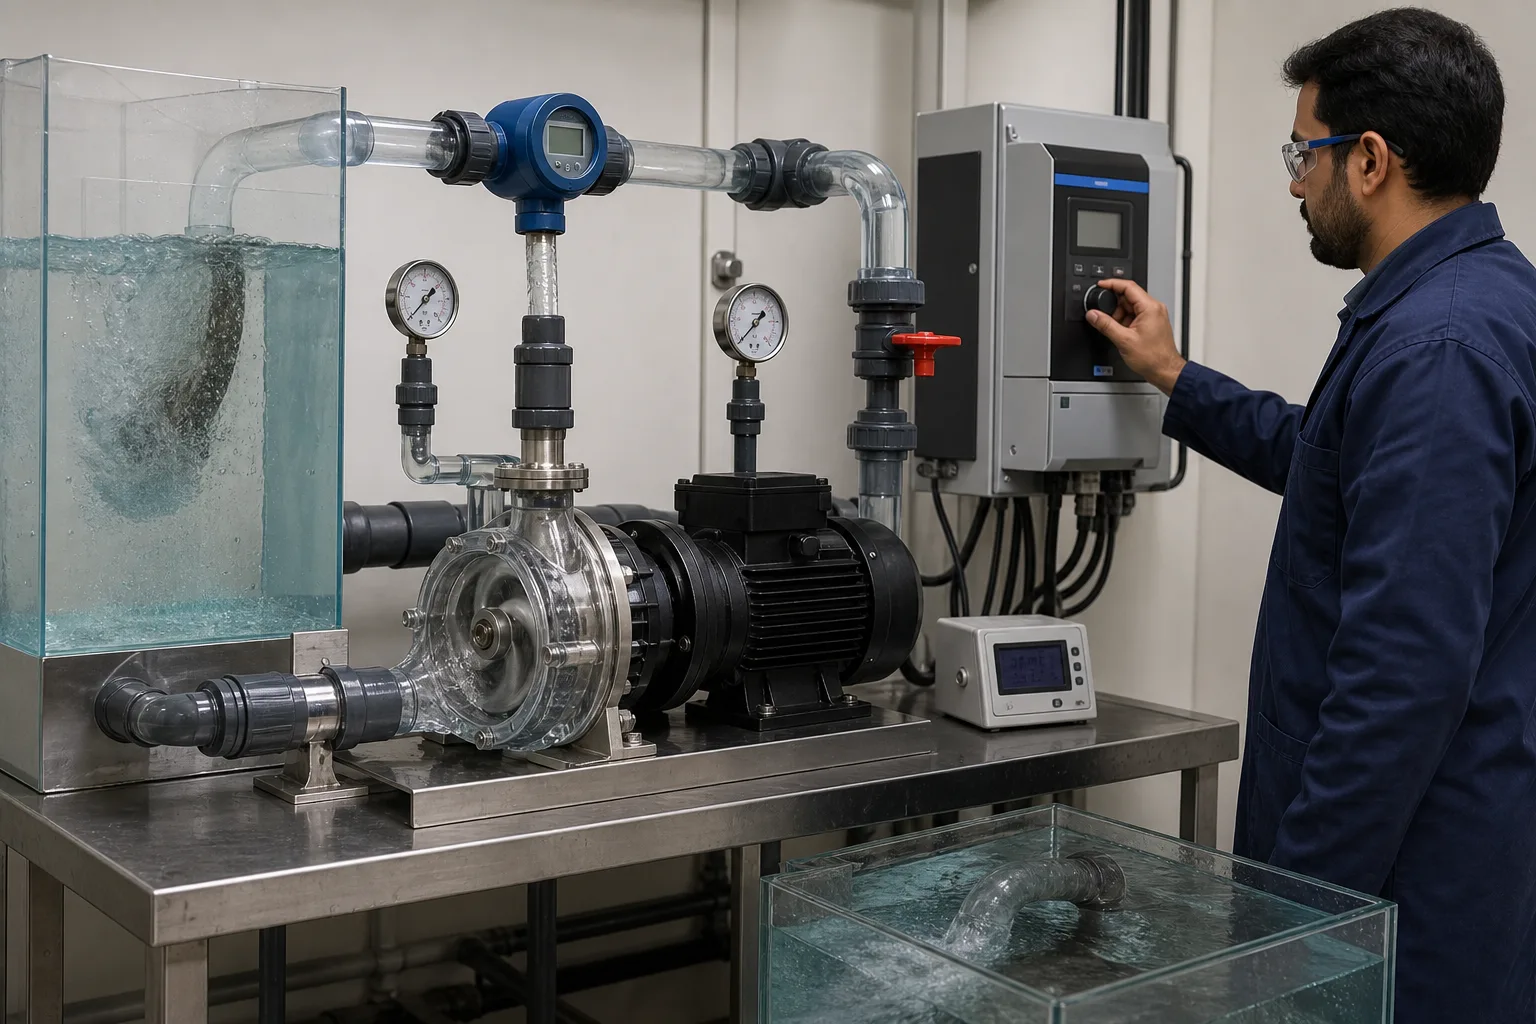 11VFD frequency and rpm22Measured flow Q33Suction/discharge pressure44Impeller and real flow
What to identify
- 1VFD frequency and rpm
- 2Measured flow Q
- 3Suction/discharge pressure
- 4Impeller and real flow
What the image proves
Affinity laws shift a pump curve; the system-curve intersection still sets Q and H.
How to verify it
Stabilize several rpm points, measure Q/H/three-phase input kW and compare with manufacturer speed curves.
Compare throttling and speed control at the same delivered service
The constant-speed loop burns surplus head across a valve; the variable-speed loop lowers pump head.
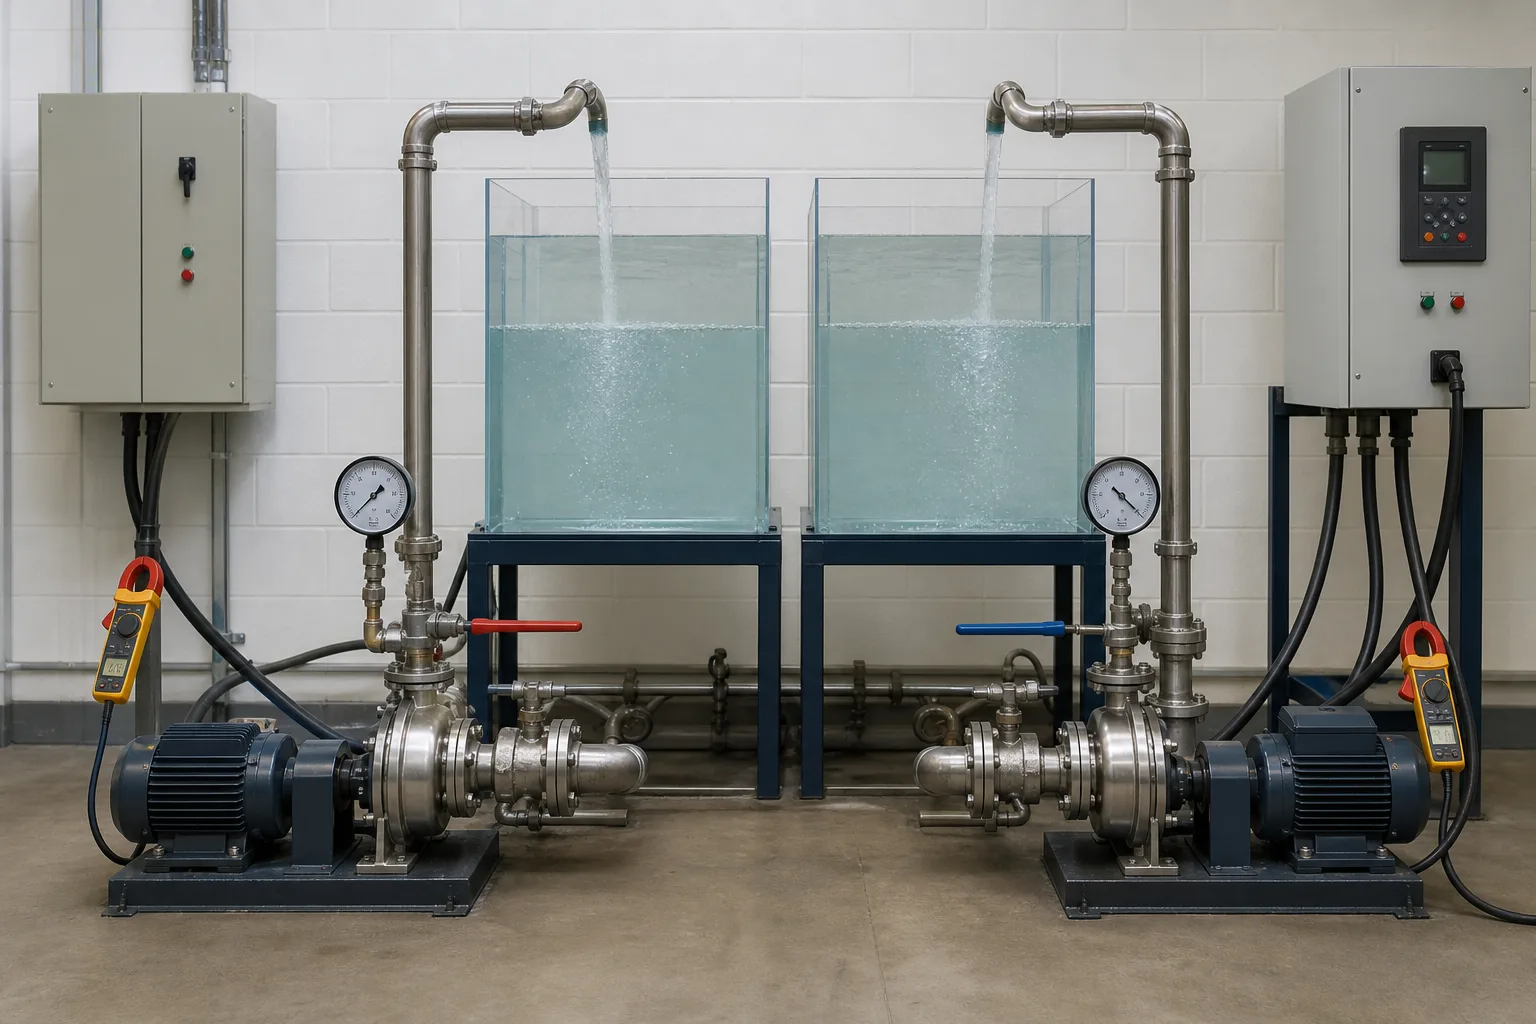 11Constant-speed pump and valve22Pressure drop dissipated at valve33Variable-speed pump44Equal flow/pressure boundary
What to identify
- 1Constant-speed pump and valve
- 2Pressure drop dissipated at valve
- 3Variable-speed pump
- 4Equal flow/pressure boundary
What the image proves
Speed control avoids creating surplus head rather than merely disposing of it.
How to verify it
Compare input kW at equal delivered volume, pressure and level; reduced delivery is not an energy saving.
Variable branch demand makes sensor location and setpoint decisive
A header serves three branches while the VFD follows the pressure actually needed by the critical user.
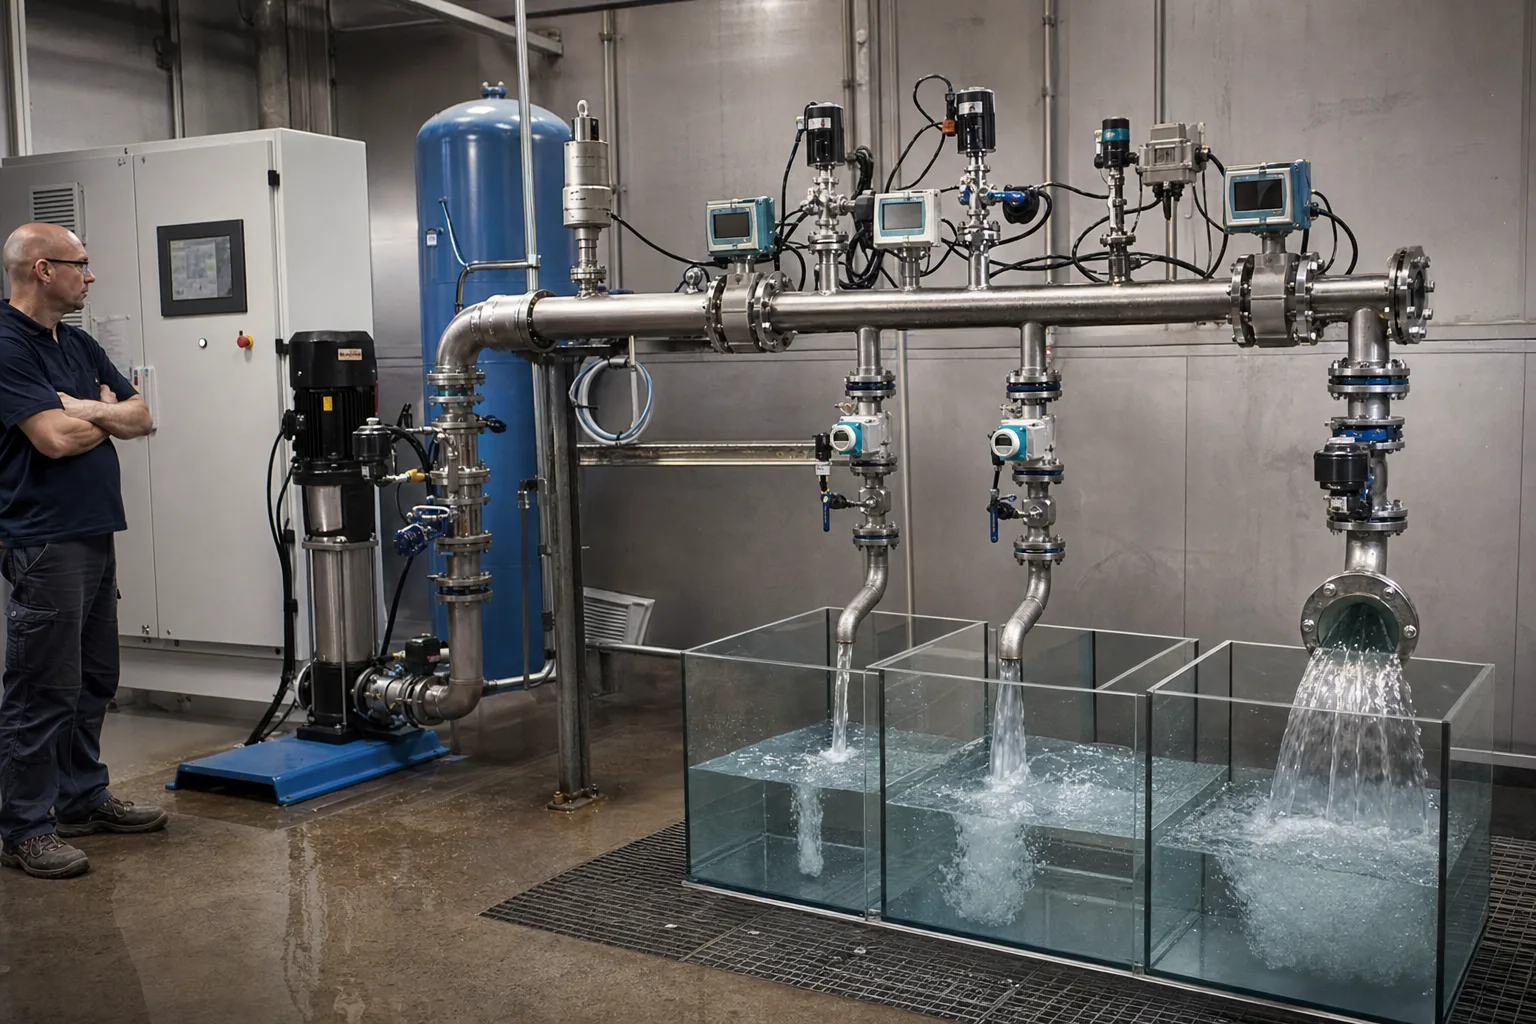 11VFD pump and vessel22Header pressure feedback33Three changing branch demands44Valve/flow and critical point
What to identify
- 1VFD pump and vessel
- 2Header pressure feedback
- 3Three changing branch demands
- 4Valve/flow and critical point
What the image proves
Remote-pressure reset can remove chronic near-user throttling caused by a fixed high pump-room setpoint.
How to verify it
Trend critical pressure, header pressure, valve positions and frequency; step down safely with low-pressure and signal-failure protection.
Final acceptance combines electrical, hydraulic and condition measurements
Input power, vibration, suction/discharge pressure and flow are measured on the same pump.
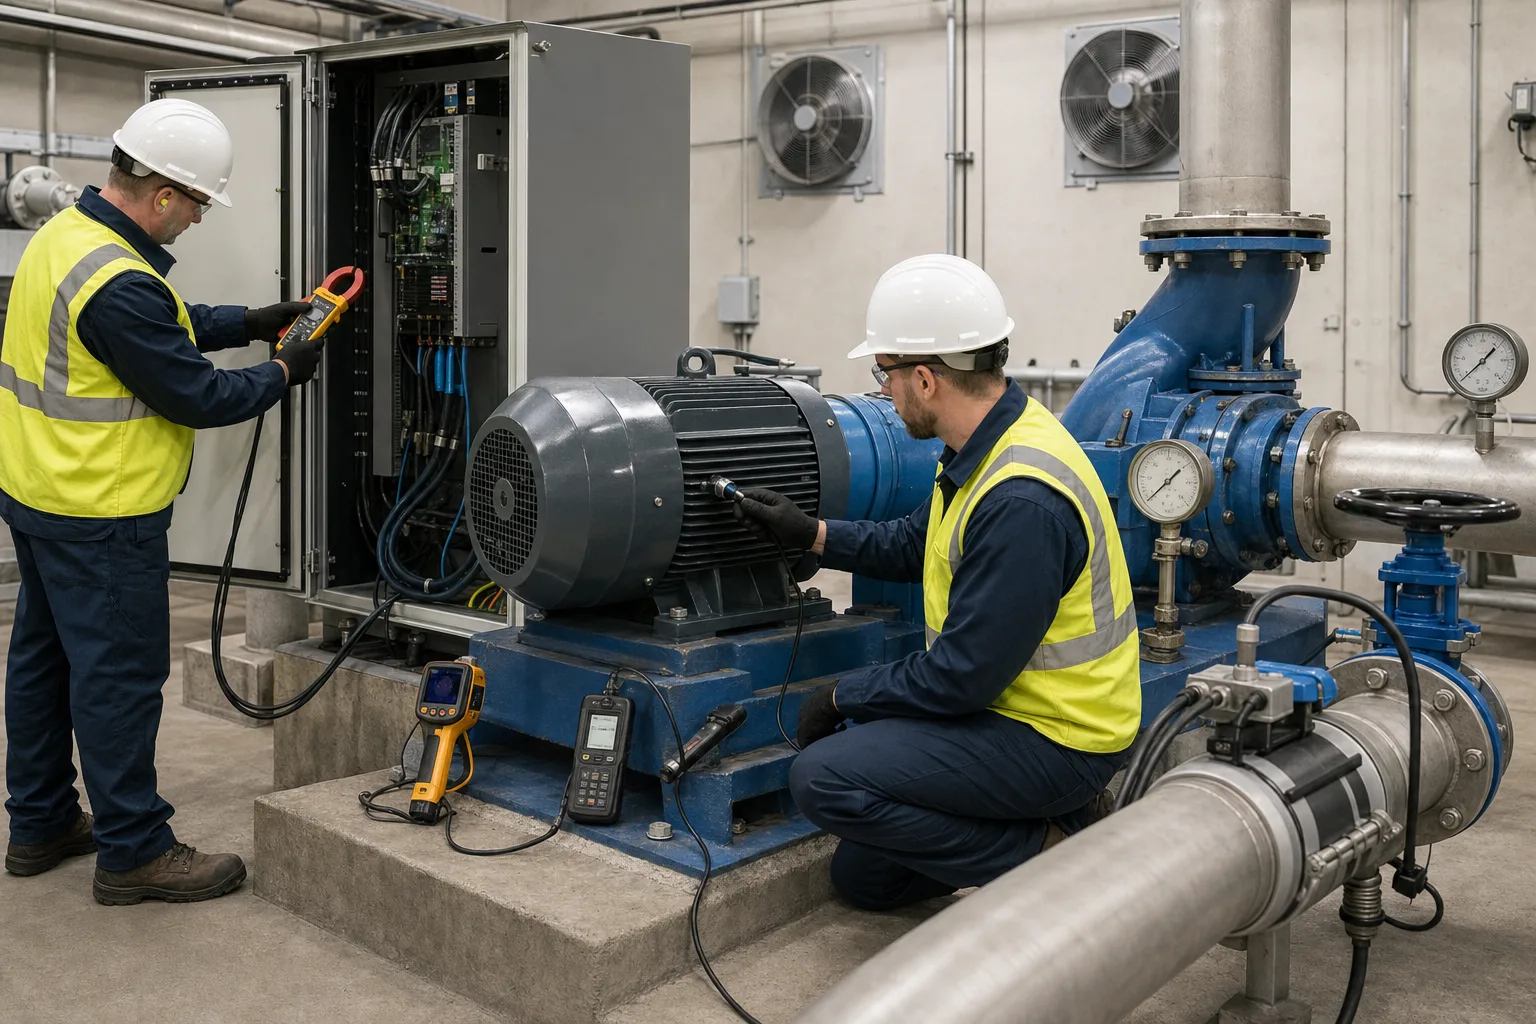 11Three-phase VFD input power22Motor/bearing vibration33Suction/discharge total head44Flow and kWh per volume
What to identify
- 1Three-phase VFD input power
- 2Motor/bearing vibration
- 3Suction/discharge total head
- 4Flow and kWh per volume
What the image proves
Valid savings preserve service and reliability while reducing kWh.
How to verify it
Calculate wire-to-water efficiency and kWh/m³ by load bin; check NPSH, heat, vibration, noise, cycling and alarms, then weight by annual hours.
Nine steps from idea to verified retrofit
Measure the load before selecting the control.
1. Define service
volume + pressure + level/process limits
Keep baseline and retrofit equivalent.
2. Build load profile
Q/P/kW/valve/bypass/units/hours
Find duration of excess head.
3. Split system head
Hstatic + KQ²
Avoid blind cube-law estimates.
4. Overlay curves
pump curves by rpm ∩ system curve
Predict point, efficiency and limits.
5. Compare options
VFD/staging/trim/new pump/pipe loss
Minimize whole-profile cost.
6. Design control
critical sensor → reset/PID → staging
Match speed and units to demand.
7. Set protection
minimum flow/rpm, NPSH, skip bands, transient
Stay inside reliability envelope.
8. Commission by bin
equal duty: input P, H, vibration, heat
Calibrate model and stability.
9. Annual acceptance
ΣPi×ti, kWh/m³, compliance, maintenance
Prove net lifecycle result.
Energy paths of four control methods
Locate surplus head and confirm useful delivery.
Constant speed + throttle
- Control
- Valve raises resistance and moves the point left.
- Loss/risk
- Surplus head becomes valve loss; noise/cavitation at small opening.
- Best evidence
- High valve ΔP with variable demand is a strong VFD lead.
Constant speed + bypass
- Control
- Part of pressurized flow recirculates.
- Loss/risk
- Repeated pumping and heating; low useful fraction.
- Best evidence
- Only for minimum-flow/brief control; optimize chronic bypass.
Variable speed
- Control
- Lower speed shifts the Q-H curve to demand.
- Loss/risk
- Static head, off-BEP, cooling, harmonic, resonance and bad control limits.
- Best evidence
- Best with variable load and friction head after curve/protection review.
Pump/hydraulic redesign
- Control
- Resize, trim, stage or reduce pipe loss.
- Loss/risk
- Bad selection still runs inefficiently; less flexible.
- Best evidence
- Often complements VFD for oversized or chronically off-design systems.
Hydraulic power is approximately ρgQH and wire-to-water efficiency is ρgQH/Pinput. Output frequency, current or nameplate efficiency cannot replace real VFD input power and total dynamic head.
Retain four evidence sets
Service/load
Total and instantaneous volume, critical pressure/level, load percentiles and hours.
Electrical input
VFD line kW/kWh, power factor, frequency/rpm, harmonics and bypass/standby.
Hydraulics
Suction/discharge head, static head, valves, pump/system curves, BEP/POR/AOR and NPSH.
Reliability
Minimum flow, temperature, vibration/resonance, cavitation, cycling, seals and fail-safe control.
Four field combinations
- Signal
- Variable demand, throttled valve, high valve ΔP
- Likely conclusion
- Strong speed-control opportunity
- Next action
- Plot load/system curves and test equal service
- Signal
- High static lift, nearly fixed flow, open valve
- Likely conclusion
- Small VFD range; cube estimate high
- Next action
- Solve intersections and compare trim/resize/staging
- Signal
- Low-frequency kW falls but remote pressure/volume fails
- Likely conclusion
- Under-delivery, not valid saving
- Next action
- Restore boundary and correct sensor/setpoint
- Signal
- Many pumps run slowly with cycling and poor efficiency
- Likely conclusion
- Staging or pump-size mismatch
- Next action
- Run fewer units near efficient range with hysteresis
Four misconceptions
Ten percent less speed always means 27% less power
The cube relationship is conditional; static head, efficiency and drive loss alter input kW.
Lower frequency is always better
Too low can under-serve, overheat, cavitate or move outside efficient/safe operation.
Current reduction equals energy reduction
Voltage, power factor, harmonics and efficiency matter; measure line kW/kWh.
A VFD fixes valves and piping
Bad setpoints, remote throttling, open bypass and pipe resistance still waste energy.