Illustrated guides · Biological treatment
Why does sludge settle in a secondary clarifier, and why can it wash out?
A secondary clarifier is not a filter. It separates and thickens activated sludge, recovers biomass through RAS and releases clarified water through distributed overflow weirs.
Direct answer
Direct answer
Mixed liquor enters a feedwell that dissipates momentum. Settleable flocs move downward into a zone-settling and compression blanket while clarified water rises to peripheral weirs. Bottom collectors move thickened sludge to a hopper; most returns as RAS and a smaller fraction leaves as WAS. Washout occurs when downward settling and sludge withdrawal cannot keep pace with incoming solids flux or upward hydraulic, gas-lift or mechanical disturbance. Peak flow, high MLSS/solids loading, bulking or pin floc, RAS/collector faults, denitrification in the blanket, short-circuiting and uneven weirs leave different signatures and require different responses.
Four capacities must hold the interface
Good settleability alone is not enough when hydraulics, solids flux or withdrawal is overloaded.
Flocs settle and compact
Dense, suitably sized flocs settle and compress; filamentous bulking, dispersed growth, pin floc or shear produces slow blankets or fine-solids breakthrough.
Influent energy is dissipated and distributed
Feedwells and baffles turn a jet into low-disturbance radial flow. Peak flow, density currents, wind, short-circuiting or uneven weirs can carry solids to one sector.
Solids flux stays within capacity
Clarifier solids loading depends on MLSS and the combined hydraulic flows that carry solids. A blanket can rise even when surface hydraulic loading looks acceptable.
Settled sludge is withdrawn uniformly
Collectors, hoppers and RAS/WAS remove the inventory. Too little withdrawal raises the blanket, but maximum RAS is not a universal answer because it also changes flow and solids loading.
A circular clarifier splits flow through center feed, peripheral overflow and bottom collection
The surface and cutaway reveal the feedwell, quiet clarification zone, V-notch weirs and settled blanket with collector mechanism.
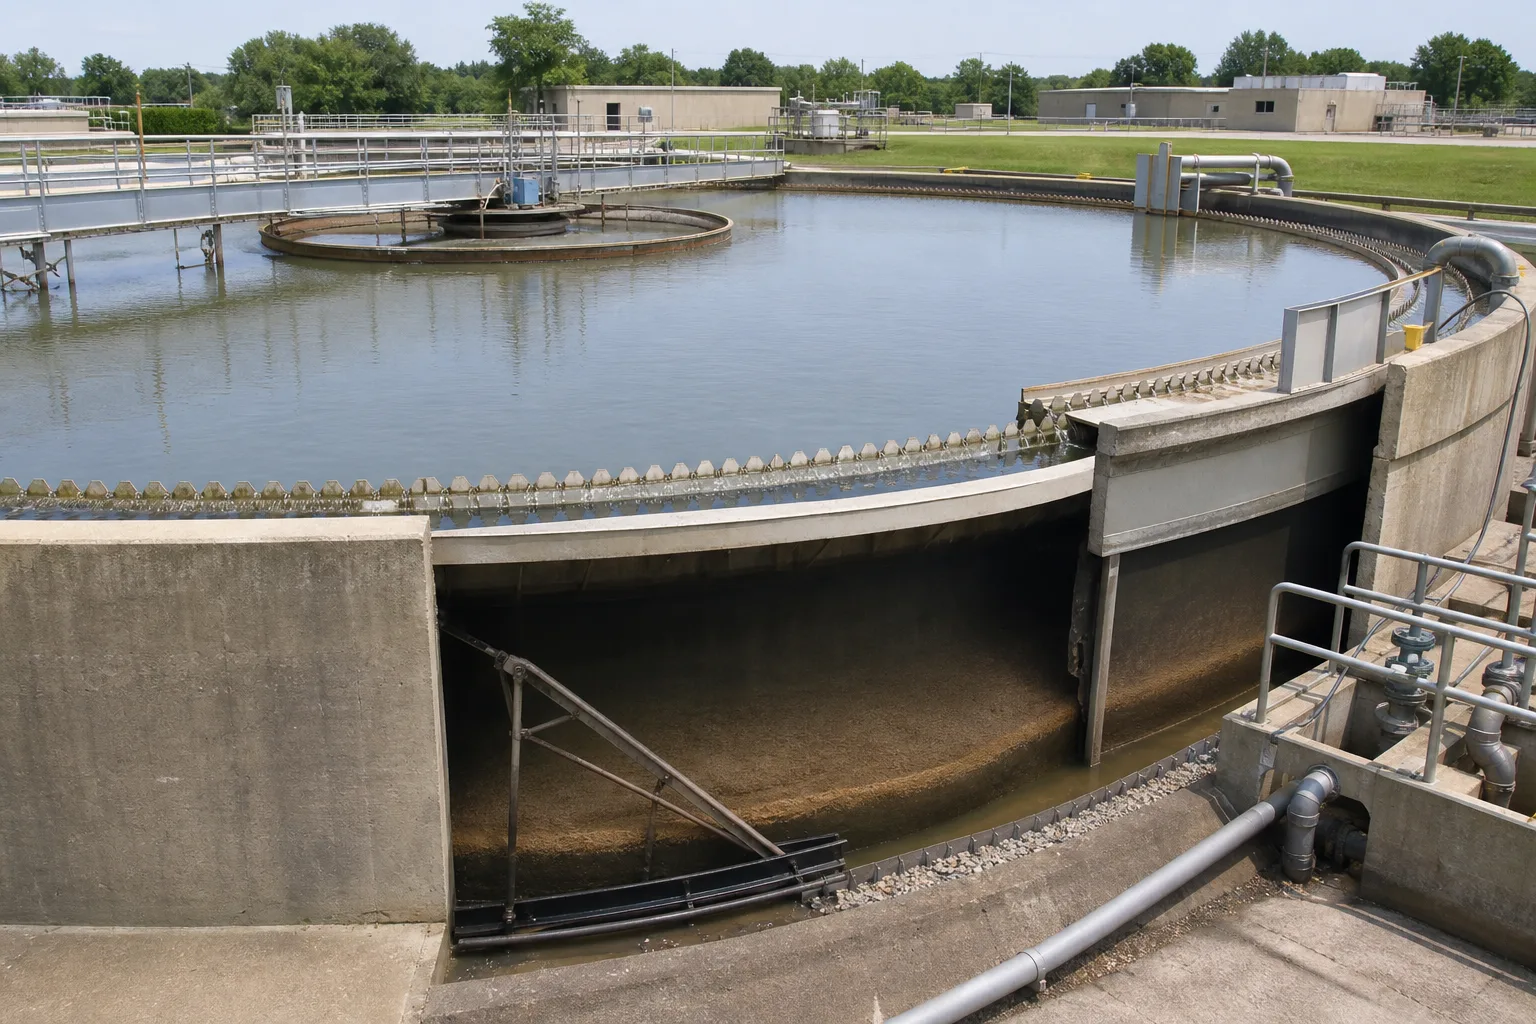 11Center feed and energy dissipation22Upper clarification zone33Peripheral effluent weir44Bottom collector and hopper
What to identify
- 1Center feed and energy dissipation
- 2Upper clarification zone
- 3Peripheral effluent weir
- 4Bottom collector and hopper
What the image proves
Detention time alone does not clarify water. Distribution, surface area, depth, weirs and continuous sludge removal operate as one separation system.
How to verify on site
Compare weir depth/turbidity around the tank, measure quadrant blankets and RAS flow/concentration, and verify collector rotation, torque and hopper draw.
Flocs—not individual bacteria—form the settling solids
Compact flocs, free fines, a gathering blanket and a filament network visualize different morphologies; the image cannot identify organisms by sight alone.
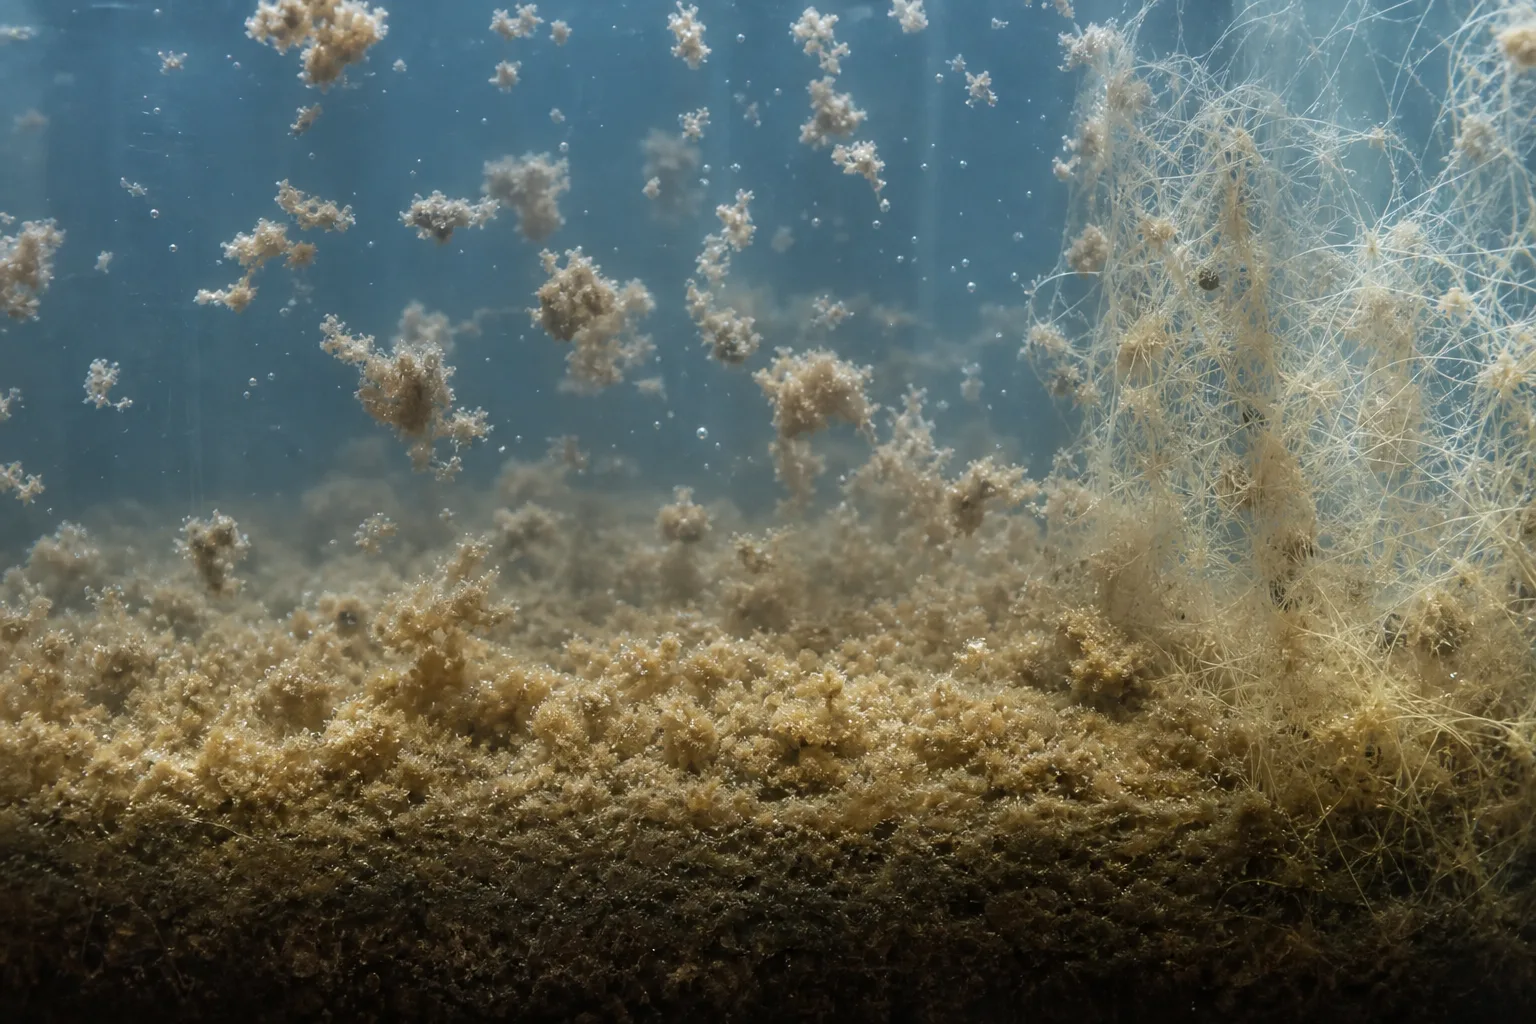 11More compact flocs22Free fines/pin floc33Zone-settling blanket44Excess filament framework
What to identify
- 1More compact flocs
- 2Free fines/pin floc
- 3Zone-settling blanket
- 4Excess filament framework
What the image proves
Excess filaments can create a low-density network, while dispersed or pin floc may pass through with a low blanket. The two forms of solids loss need different control.
How to verify on site
Align the 30-minute curve, SVI/diluted settling, supernatant fines and microscopy to distinguish slow blanket settling from fine-solids breakthrough.
The cutaway connects clarification, zone settling, compression and RAS recovery
Mixed liquor leaves the feedwell, clear water rises, solids concentration increases downward and collector arms move bottom sludge to the outlet.
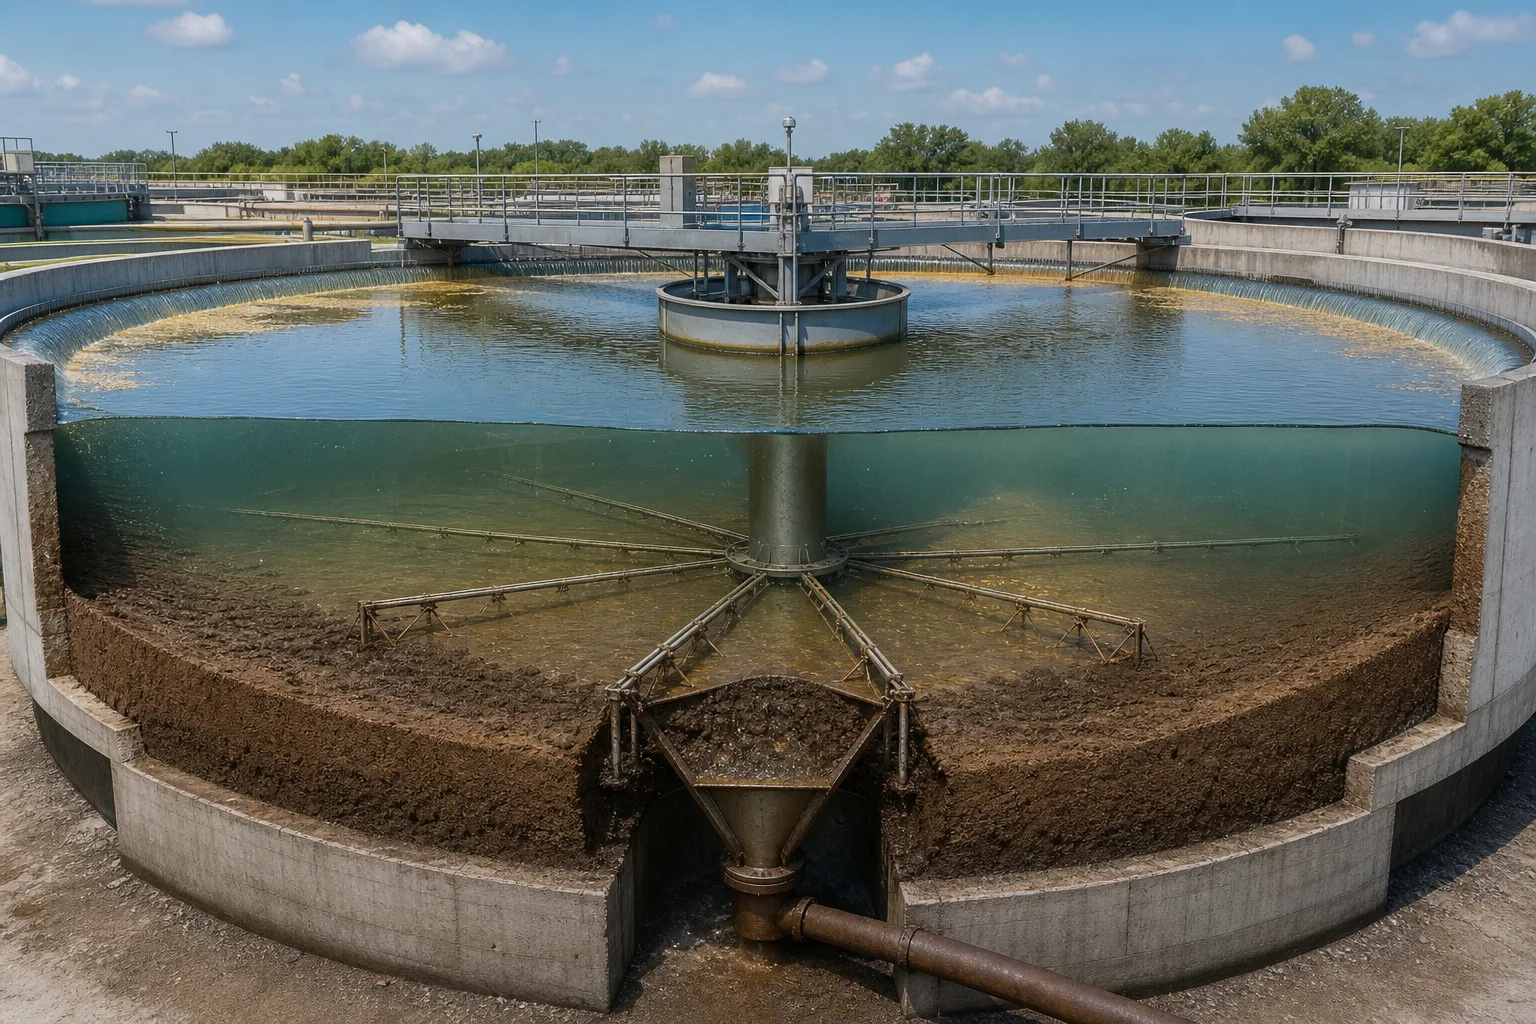 11Feedwell discharge zone22Rising clarified-water flow33Settling/compression blanket44Collector to RAS/WAS outlet
What to identify
- 1Feedwell discharge zone
- 2Rising clarified-water flow
- 3Settling/compression blanket
- 4Collector to RAS/WAS outlet
What the image proves
A stable interface is a dynamic balance, not stored sludge. A continuously rising interface shows that solids inventory is accumulating faster than it is concentrated and removed.
How to verify on site
Trend incoming MLSS×flow solids load, RAS/WAS solids output and blanket elevation, with shorter intervals through peak flow.
Settling columns separate concentration effects from low-density sludge
Parallel columns show clear supernatant and compacted sludge, a dilution comparison and a high fluffy blanket; jars reveal supernatant quality.
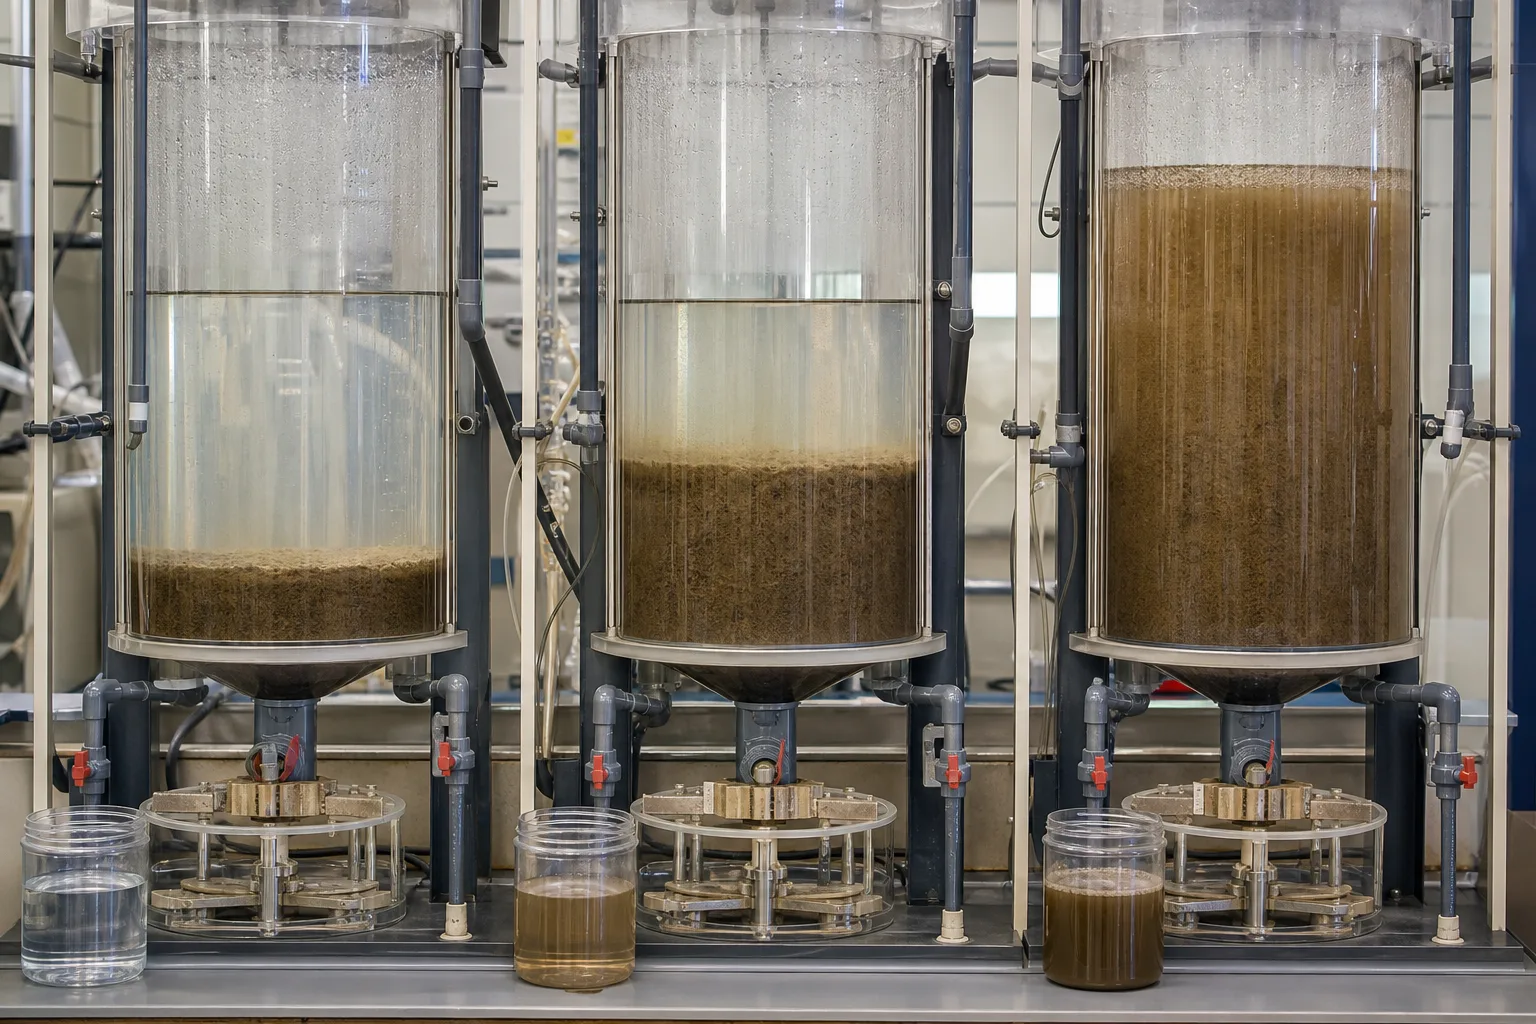 11Normal clear zone/compact sludge22Diluted settling comparison33High fluffy blanket44Fine-solids supernatant sample
What to identify
- 1Normal clear zone/compact sludge
- 2Diluted settling comparison
- 3High fluffy blanket
- 4Fine-solids supernatant sample
What the image proves
Faster settling after dilution points toward excessive concentration; little change after dilution points toward low-density morphology. A batch column still lacks full-scale flow and scraping.
How to verify on site
Record original and standardized diluted samples at 2, 5, 10 and 30 minutes, calculate SVI, and compare with full-scale blanket, TSS and microscopy.
Diagnosis aligns settling tests, blanket behavior and operating context
Two settling samples sit between the aeration basin and clarifier while the background shows a quiet clarifier beside turbulent mixed liquor.
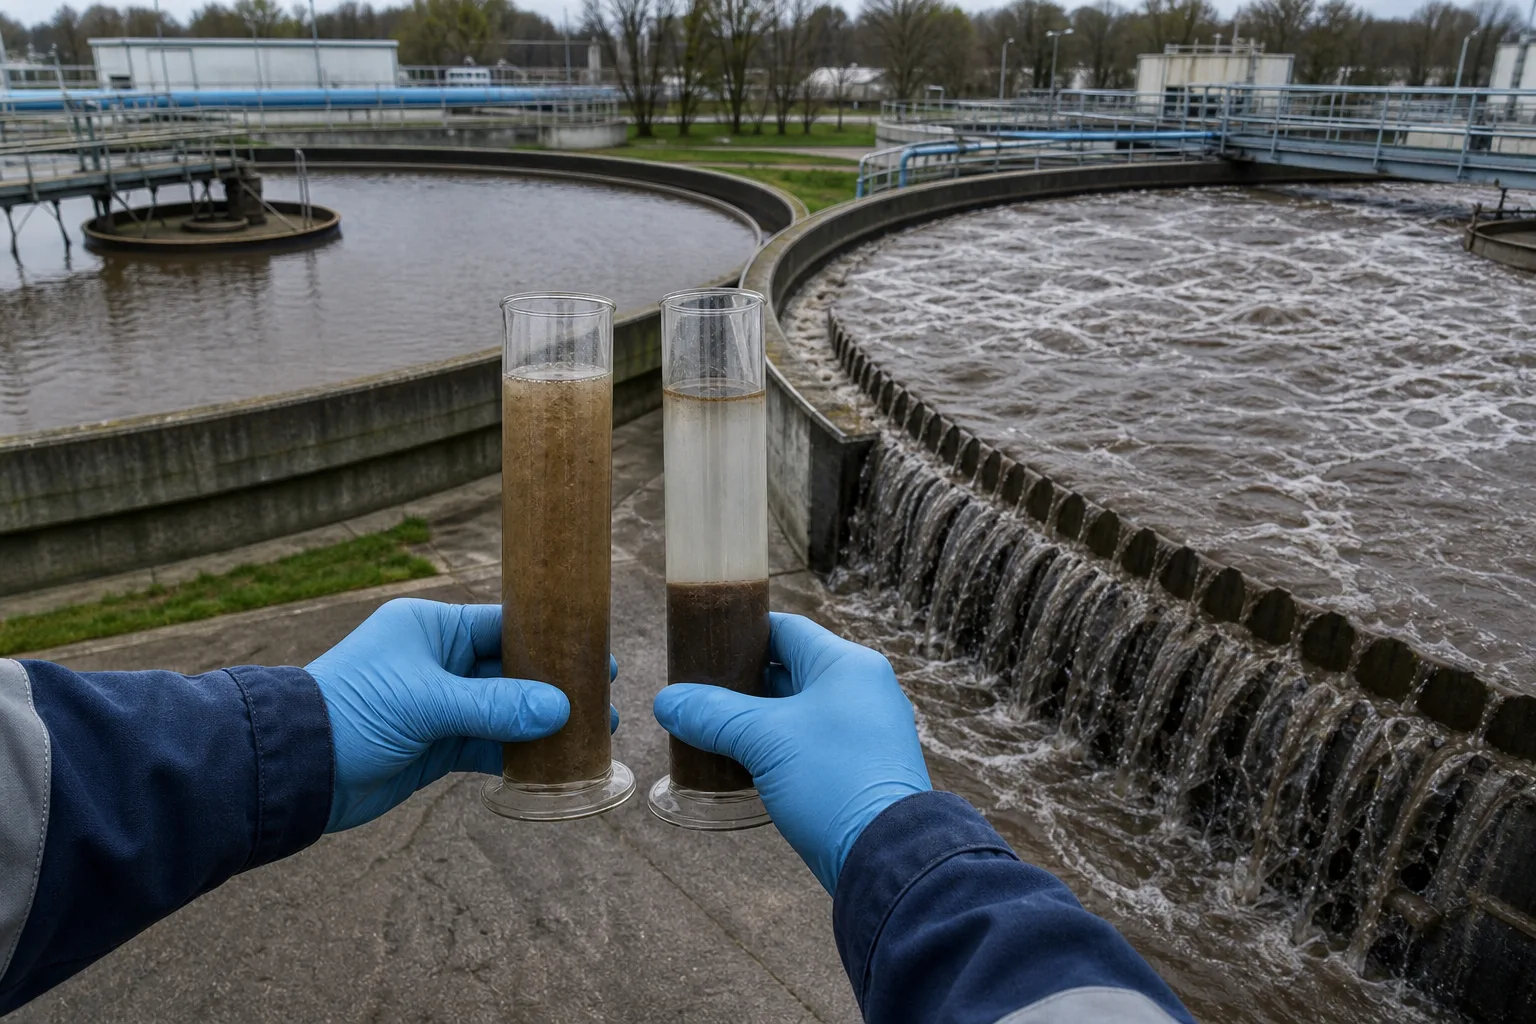 11Original mixed-liquor settling22Diluted/control settling33Clarifier blanket and surface44Adjacent aeration-basin state
What to identify
- 1Original mixed-liquor settling
- 2Diluted/control settling
- 3Clarifier blanket and surface
- 4Adjacent aeration-basin state
What the image proves
Uniform whole-perimeter turbidity suggests a system-wide load or sludge issue; one dirty sector suggests distribution, wind, weir or collector trouble; floating gas-laden rafts suggest denitrification.
How to verify on site
Map perimeter turbidity/TSS, blanket and floating solids while recording flow, MLSS, RAS/WAS, nitrate, temperature, SVI and collector events.
Six flows through the secondary clarifier
Follow water and solids together to see clarification and biomass recovery.
1 Mixed liquor enters
Solids-bearing flow → feedwell
Distribute biological effluent over effective settling area.
2 Dissipate energy
Jet → low-disturbance radial flow
Reduce short circuiting, floc shear and clear-zone disturbance.
3 Zone settling
Flocs ↓; clarified water ↑
Form an interface and capture biological solids.
4 Blanket compression
Crowded flocs → thickened underflow
Increase bottom-solids concentration.
5 RAS and WAS
Bottom sludge → process / solids handling
Retain biomass, control SRT and prevent accumulation.
6 Effluent overflows
Supernatant → disinfection/tertiary
Collect clarified water uniformly and reveal capture by TSS/turbidity.
Four boundaries behind solids washout
Classify hydraulics, solids flux, sludge quality or withdrawal before changing operation.
Inlet/outlet hydraulics
- Primary duty
- Distribute flow, dissipate energy and collect effluent uniformly
- Typical upset
- Peak flow, density current, short circuit, uneven weir or wind creates local loss
- Field evidence
- Basin flow, feedwell pattern and perimeter weir depth/turbidity map
Settling and solids flux
- Primary duty
- Settle, form an interface and thicken downward
- Typical upset
- High MLSS/load, slow settling or poor compaction raises the blanket
- Field evidence
- Solids load, blanket trend, settling curve, SVI and supernatant
Sludge morphology
- Primary duty
- Build flocs with useful size, density and strength
- Typical upset
- Bulking, dispersed growth, pin floc, shear or toxicity
- Field evidence
- Microscopy, diluted settling, floc size/strength, OUR and bioreactor state
Collector/RAS/WAS
- Primary duty
- Withdraw bottom solids uniformly and control inventory/SRT
- Typical upset
- Collector, hopper, pump or line fault; prolonged blanket residence or mismatched return
- Field evidence
- Torque/speed, hopper draw, RAS flow/concentration, WAS mass and blanket gas
Use project-specific geometry, peak flow, temperature, MLSS, SVI, RAS and design documents for limits. Generic values only flag magnitude. Increasing RAS can lower a blanket through withdrawal but also changes return concentration, flow and incoming solids load; verify the complete balance.
Align three evidence groups
Hydraulic and solids balance
Total/basin flow, peak events, MLSS, flow split, RAS/WAS flow and concentration, surface hydraulic loading, solids loading and basin availability.
Settleability and biology
2–30 minute curve, SVI/diluted settling, supernatant, microscopy, SRT/F:M, DO, temperature, nutrients and toxicity/shear events.
Tank and effluent map
Multipoint blanket, perimeter turbidity/TSS, floating solids/bubbles, feedwell, weirs, scum baffle, collector torque and each hopper.
Different TSS patterns, different causes
- Combined signal
- Blanket rises basin-wide; supernatant starts clear, then solids spill around the perimeter
- Suspect first
- Incoming solids flux exceeds settling, thickening and RAS/WAS output
- Next step
- Build a basin solids balance, verify hopper/RAS flow and concentration, restore failed units and adjust within design limits
- Combined signal
- High fluffy blanket; original and diluted samples both settle slowly; microscopy shows many filaments
- Suspect first
- Low-density filamentous bulking rather than concentration alone
- Next step
- Trace SRT/F:M, DO, nutrients, septicity/sulfide and selector conditions; separate emergency chemicals from biological correction
- Combined signal
- Blanket is low but uniform fine pin floc persists in effluent
- Suspect first
- Dispersed/weak floc, shear, sludge age imbalance or recovery from a shock
- Next step
- Inspect supernatant/microscopy and SRT/F:M, shear, nutrients and toxicity; increasing RAS alone will not capture fines
- Combined signal
- Gas-laden rafts rise, or only one weir sector turns dirty
- Suspect first
- Rafts suggest blanket denitrification; a local sector suggests hydraulics, level, wind or collector trouble
- Next step
- For rafts check nitrate, temperature and blanket residence; for local loss map the tank and inspect feedwell, weir and collector
Four common misconceptions
A larger, longer clarifier is always better
Area, depth, distribution and withdrawal must work together; excessive blanket residence can promote gas lift or septicity.
High blanket means maximum RAS
More RAS changes both withdrawal and return flow/solids load. Verify hoppers, concentration, pumps and the mass balance first.
High SVI proves filaments; low SVI prevents washout
SVI is one batch index. Fines, hydraulics, gas lift and mechanical faults can cause washout at moderate SVI.
High effluent TSS proves poor biology
Separate reaction from separation: a hydraulic or mechanical clarifier upset can lose good biomass, while sludge morphology may originate upstream.