Illustrated guides · Disinfection, oxidation, and micropollutants
How does chlorine inactivate microorganisms in water?
Chlorine forms mainly hypochlorous acid (HOCl) and hypochlorite (OCl⁻) in water and disables microorganisms through multiple oxidative targets; real performance depends on residual, effective contact time, water quality, and organism.
Direct answer
Direct answer
Chlorination does not strain bacteria from water, and its action is not one simple puncture. Chlorine gas or hypochlorite establishes HOCl ⇌ H⁺ + OCl⁻ in water. Within common treatment ranges, lower pH generally raises the undissociated HOCl fraction, which usually penetrates envelopes and disinfects faster than OCl⁻. Available chlorine can oxidize membranes, sulfhydryl enzymes, amino acids, respiratory components, nutrient uptake, ATP production, protein synthesis, and nucleic acids. Failure of several critical functions prevents infection or reproduction. Dose first reacts with organic matter, ferrous iron, nitrite, sulfide, and other reducers; ammonia forms chloramines, so applied dose is not the free residual organisms actually experience. Engineering exposure is often expressed as CT—disinfectant residual C times effective contact time T—but T must account for peak flow, baffles, short circuits, and dead zones, not just volume divided by flow. Low temperature, high pH, turbidity or particle shielding, and rising chlorine demand increase required exposure. Organism resistance differs, and Cryptosporidium oocysts are notably resistant to conventional low-dose chlorination. Control therefore pairs feed verification, contact-basin residual, and microbial results while limiting disinfection byproducts; wastewater discharge may also require dechlorination.
Four conditions make chlorination reliable
Chlorine odor, one online number, or one clean plate cannot independently prove the barrier.
Meet demand before relying on residual
Organics, ammonia, nitrite, Fe/Mn, and sulfide consume or change chlorine. Distinguish applied dose, demand, free residual, and total residual under representative water quality.
Use real CT, not nominal detention
Rapid mix exposes every stream and baffles reduce short-circuiting. Use residual at the relevant point and an effective time such as tracer-derived T10 at peak flow.
Include pH, temperature, and particle shielding
pH changes HOCl/OCl⁻, cold water generally slows inactivation, and floc or suspended particles can shield embedded organisms. Pretreatment stability is part of disinfection.
Control inactivation and byproducts together
Organisms need different CT. Higher dose/time can improve kill but also increases residual, corrosion, and THM/HAA risk, so unlimited chlorination is not a safe control strategy.
Feed and rapid mixing come first; a baffled basin then provides contact
Metering pumps and piping on the left deliver chlorine, multiple channels limit short circuits, and an analyzer and sample point near the end verify residual before discharge downstream.
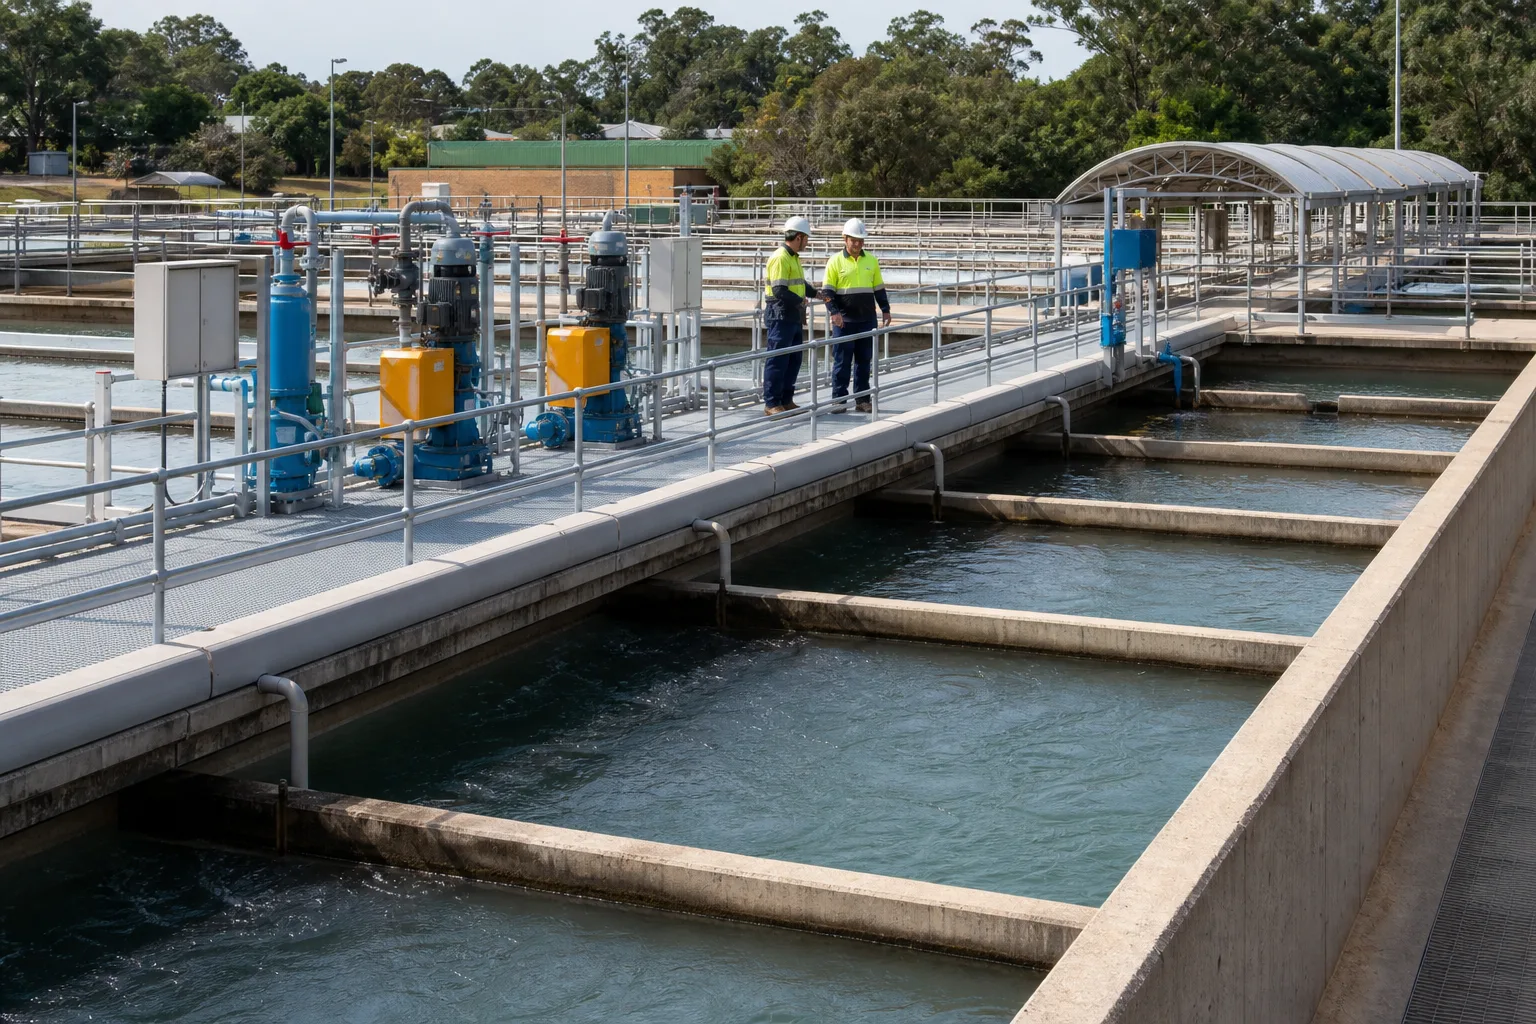 11Chlorine metering pumps/piping22Injection and rapid-mix point33Baffled contact channels44Final residual/effluent point
What to identify
- 1Chlorine metering pumps/piping
- 2Injection and rapid-mix point
- 3Baffled contact channels
- 4Final residual/effluent point
Figure takeaway
The basin is not defined by storage volume alone. Every stream must receive a uniform dose and a verifiable minimum contact time; one locally high concentration cannot compensate for an untreated short circuit.
How to verify it in the field
Verify pump calibration, solution strength, and initial mix. At peak flow, use tracer or a validated hydraulic model and measure segment/final free and total residual, pH, temperature, and flow.
Microscopy illustrates multi-target damage, not one universal hole
Intact rods on the left contrast with wrinkled, ruptured cells and debris on the right. Real inactivation also includes enzyme, respiration, and nucleic-acid damage invisible in morphology.
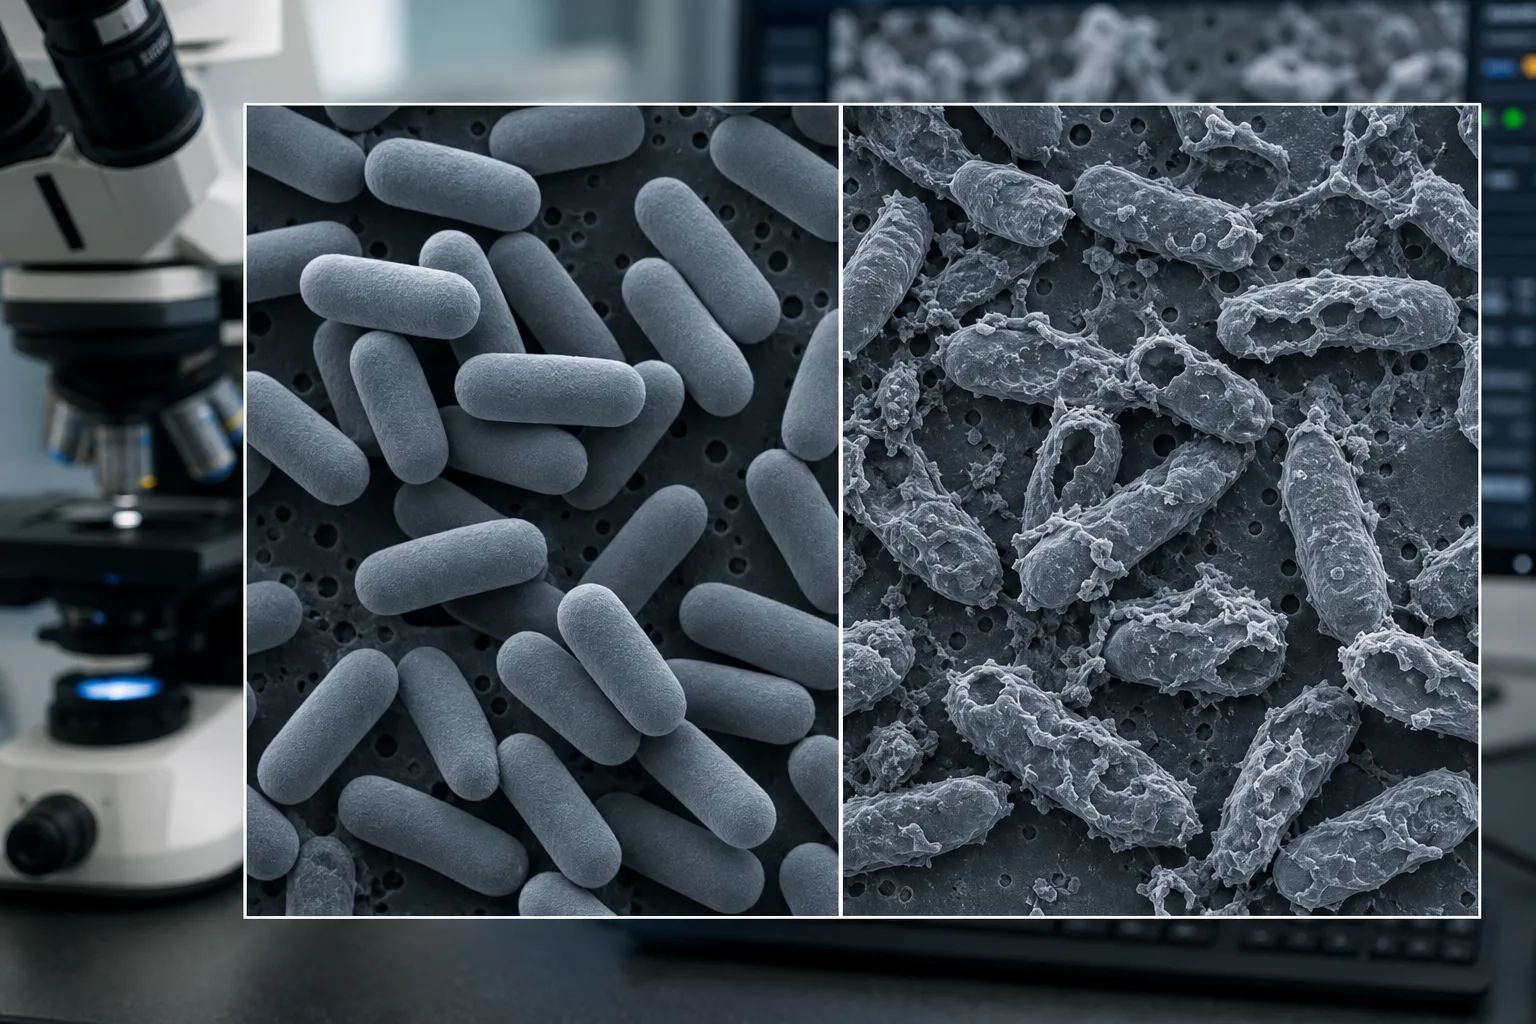 11Intact cell morphology22Continuous cell envelope33Collapsed/leaking envelope44Debris and severely damaged cells
What to identify
- 1Intact cell morphology
- 2Continuous cell envelope
- 3Collapsed/leaking envelope
- 4Debris and severely damaged cells
Figure takeaway
Visible envelope damage is only one outcome. Chlorine may disrupt permeability, enzymes, energy metabolism, proteins, and DNA; normal appearance does not prove infectivity, and damaged appearance does not replace culture or infectivity tests.
How to verify it in the field
Use paired untreated/treated samples with recorded residual-time exposure. Select culture, infectivity, or accepted surrogates for the target; use microscopy only as mechanistic or integrity support.
A baffled pilot links dose, contact distribution, residual decay, and effluent
A pump feeds chlorine at the left, serial chambers provide contact, sampling cylinders profile decay, and the terminal probe and outlet close the CT calculation.
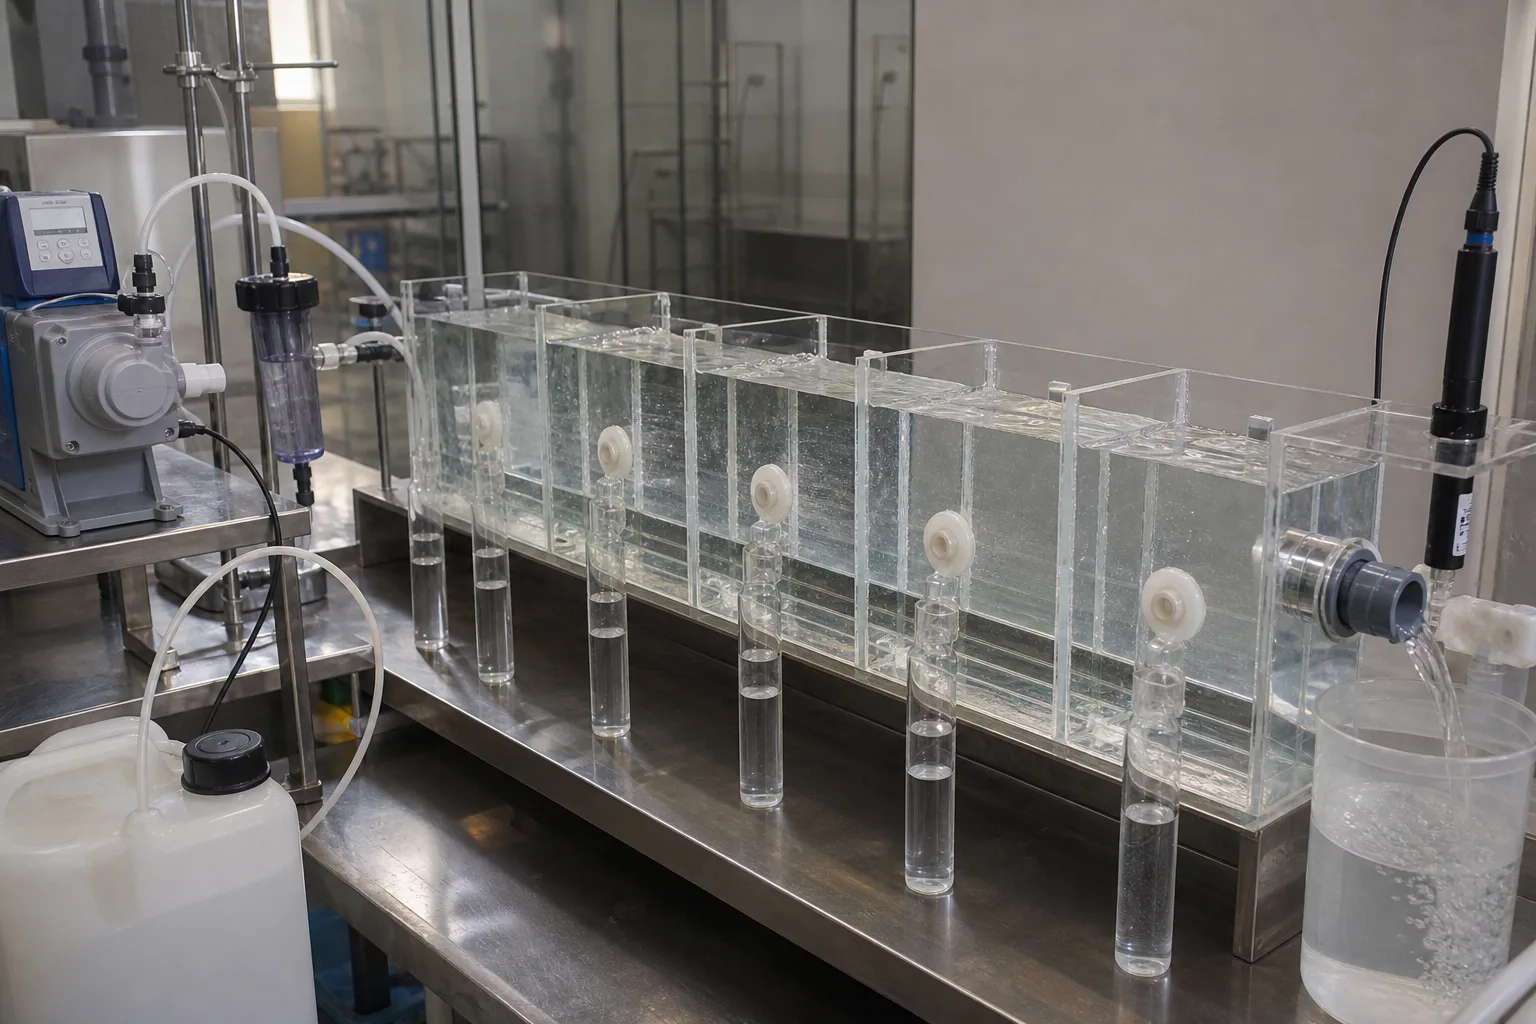 11Disinfectant metering/injection22Serial baffled chambers33Residual/microbial profile samples44Terminal probe and outlet
What to identify
- 1Disinfectant metering/injection
- 2Serial baffled chambers
- 3Residual/microbial profile samples
- 4Terminal probe and outlet
Figure takeaway
C decays along the path and T is not identical for every parcel. An inlet dose alone overstates exposure; use appropriate residual and effective time under worst water and peak flow.
How to verify it in the field
Run demand/decay tests and profile free and total residual. Use salt or dye tracing for the residence-time distribution/T10, then combine pH, temperature, flow, and inactivation.
Paired waters and plates connect dose, time, shielding, and microbial outcome
Equal-volume jars represent treatment conditions, culture plates show colony reduction, and the turbid challenge water shows how particles and demand can protect organisms and consume chlorine.
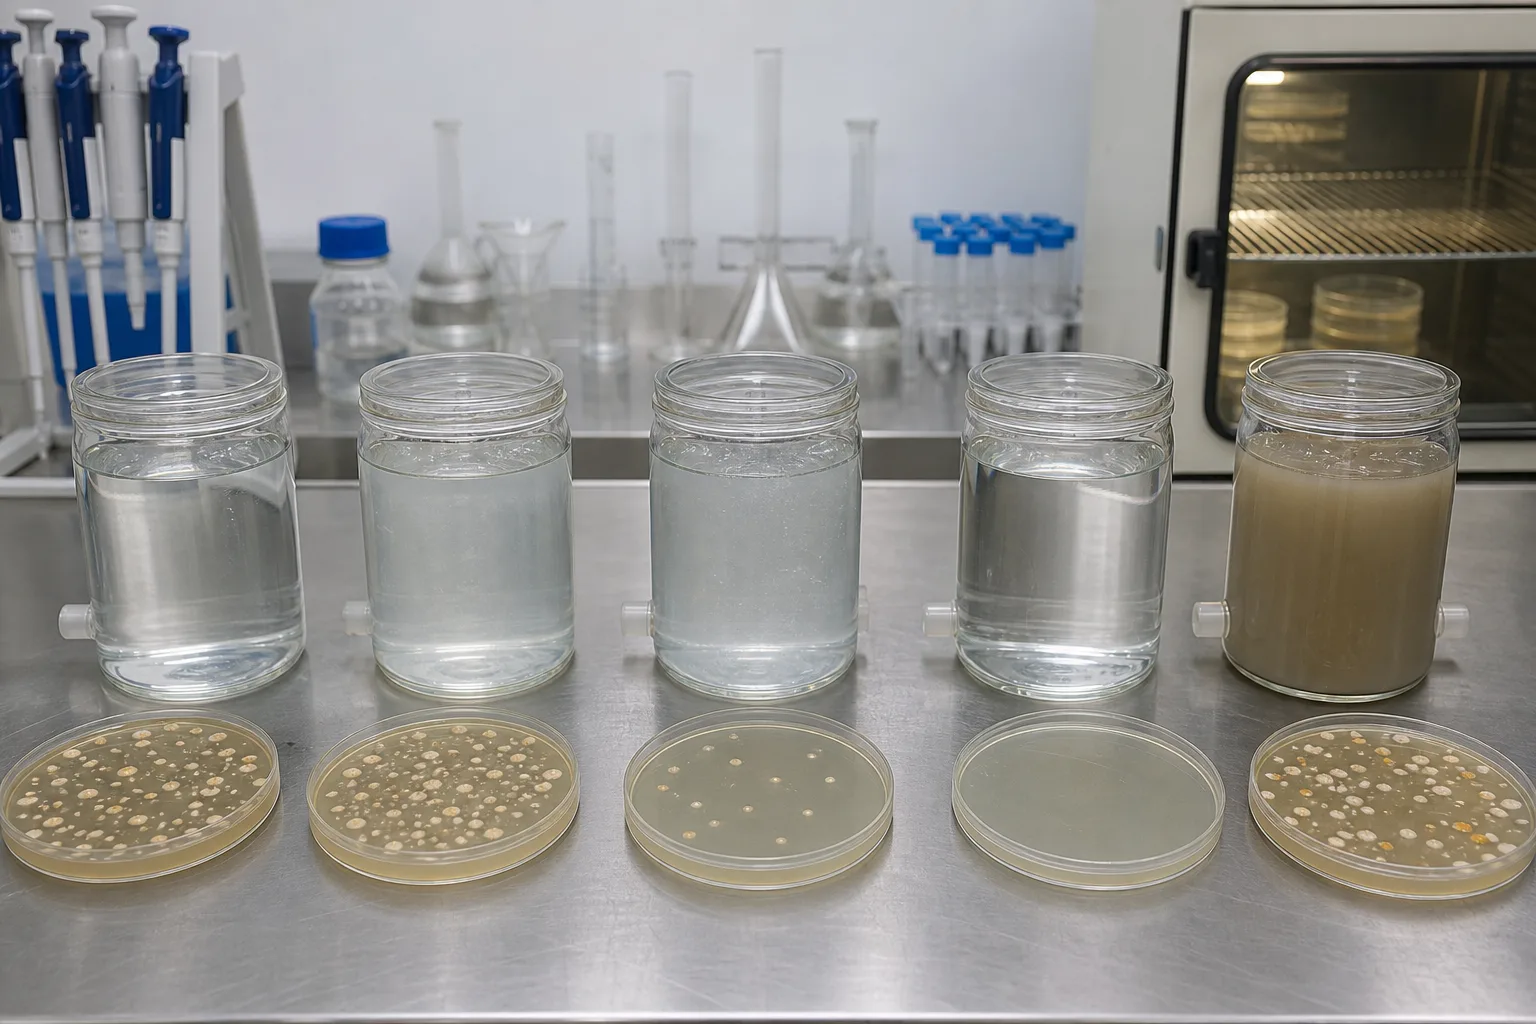 11Untreated/high-colony control22Insufficient dose or time33Target exposure/low colonies44Turbid high-demand challenge
What to identify
- 1Untreated/high-colony control
- 2Insufficient dose or time
- 3Target exposure/low colonies
- 4Turbid high-demand challenge
Figure takeaway
The same applied dose does not produce the same inactivation in different waters. Paired controls must link residual × time to microbial reduction rather than treating clarity or pump setting as the result.
How to verify it in the field
Create blank, dose, time, pH/temperature, and turbidity gradients. Measure free/total residual with replicate microbial tests and report detection limits, log reduction, and contamination controls.
Field control aligns online residual, colorimetric checks, and microbial sampling
Operators compare reacted color tubes at the basin outlet while an online probe trends continuously; raw and treated bottles relate demand, residual, and final quality.
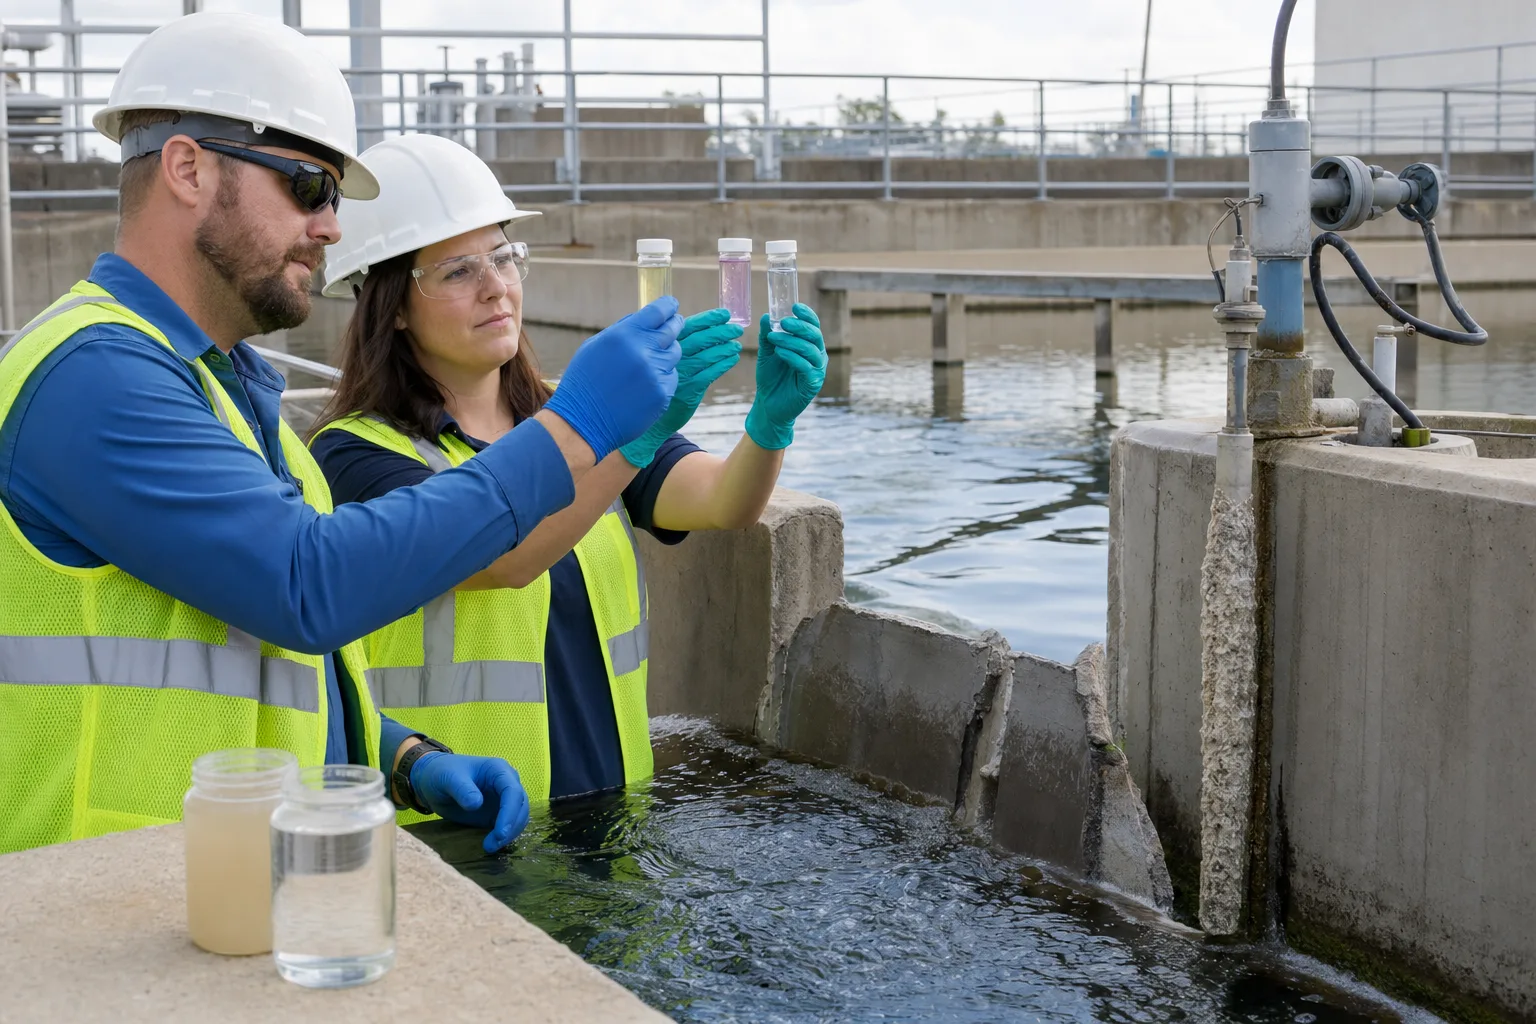 11Contact-basin outlet sample22Residual color comparator tubes33Paired raw and treated waters44Online probe/service interface
What to identify
- 1Contact-basin outlet sample
- 2Residual color comparator tubes
- 3Paired raw and treated waters
- 4Online probe/service interface
Figure takeaway
Residual is real-time process evidence, not a pathogen test. Online instruments respond quickly but drift; manual methods check the analyzer, while microbial and DBP testing verifies the health and compliance outcome.
How to verify it in the field
At one place/time compare online output with an approved free/total chlorine method plus flow, pH, and temperature. Preserve calibration, blank, dechlorinated sample-bottle, and chain records.
Six steps from feed to verified inactivation
Separating chlorine form, demand, contact, and outcome explains why organisms can remain after chlorine was added.
1 Metered feed
Chlorine/hypochlorite → flow
Deliver a mass dose based on real solution strength and water flow.
2 Aqueous speciation
HOCl ⇌ H⁺ + OCl⁻
Let pH, temperature, and water chemistry set active forms.
3 Chlorine demand
Chlorine + reducers/ammonia/organics
Separate consumption, chloramine formation, and remaining residual.
4 Effective contact
Residual C × effective time T
Expose the least-contacted water enough for the target organism.
5 Multi-target inactivation
Envelope/enzymes/metabolism/DNA damaged
Prevent infection, repair, or reproduction.
6 Outcome and risk
Residual + microbes + DBPs/dechlorination
Prove control while managing downstream exposure.
What the four subsystems must do
Reliable disinfection combines chemical feed, contact hydraulics, independent verification, and residual-risk control.
Storage, metering, initial mix
- Primary role
- Store safely, feed by flow/demand, and mix quickly
- Typical failure
- Solution decay, miscalibration, gas lock/blockage, backflow, or weak mixing
- Key evidence
- Available chlorine, stock temperature/age, pump calibration/output, valves, injection point, inlet residual
Contact-basin hydraulics
- Primary role
- Reduce short circuits/dead zones and provide time at peak flow
- Typical failure
- Damaged baffles, level/flow shift, deposits, bypass, or wind-driven surface flow
- Key evidence
- Flow/level, tracer RTD/T10, segment residual, deposits, bypass valves, hydraulic inspection
Residual and microbial verification
- Primary role
- Trend the process and independently confirm it by manual and microbial methods
- Typical failure
- Fouled/drifting probe, expired reagent, poor sample location, no dechlorination in bottle, culture contamination
- Key evidence
- Online/manual comparison, calibration/blanks, chain, free/total chlorine, indicators/targets, trends
Byproduct and terminal control
- Primary role
- Limit precursor reaction, excess residual, and toxicity; dechlorinate when needed
- Typical failure
- Overfeed, higher precursors, excessive age, under/over-dechlorination, or poor reaeration
- Key evidence
- TOC/UV254, ammonia, THM/HAA, terminal residual, dechlorant/ORP, receiving-water and permit data
Drinking-water and wastewater targets, residual rules, CT procedures, indicators, and terminal handling differ. This page explains shared mechanisms, not a universal dose. Apply local requirements, target organisms, and validated hydraulics.
Align three data groups with the same peak-flow event
Dose and demand
Actual available chlorine, chemical and water flow, pH, temperature, ammonia/nitrite, TOC/UV254, turbidity/TSS, and inlet free/total chlorine.
Contact and residual
Channel flow/level, tracer T10, segment and outlet free/total residual; calculate applicable CT for target, temperature, pH, and peak hour.
Outcome and cost
Indicators/targets, log inactivation, DBPs, corrosion/odor, post-dechlorination residual, chemical use, and bypasses; align sample timestamps to trends.
How combined signals locate microbial failure
- Combined signal
- Pump output is normal but inlet and outlet residual both fall as ammonia/turbidity/organics rise
- Suspect first
- Demand spike or decayed solution rather than contact time alone
- Next step
- Retest solution strength and demand curve; reconcile mass feed, stabilize pretreatment/feed, then reassess CT
- Combined signal
- Inlet residual is high and average outlet acceptable, but some channels/times fail microbes
- Suspect first
- Short circuit, dead zone, bypass, or peak-flow loss of T10
- Next step
- Profile residual and trace at peak flow; inspect baffles, deposits, levels, and valves; recalculate the worst path
- Combined signal
- Online residual jumps while manual tests are stable and microbes do not change
- Suspect first
- Probe fouling, bubbles, calibration/temperature compensation, or sample-flow fault
- Next step
- Confirm manually, clean/calibrate, inspect flow cell/pump/reagent, and avoid a large dose change from one bad reading
- Combined signal
- Microbes comply but THM/HAA or terminal residual rises
- Suspect first
- Dose/contact above need, more precursors, or shifted control point
- Next step
- Compare required and achieved CT, improve precursor removal and feed placement/dose; verify wastewater dechlorination without sacrificing the barrier
Four common misconceptions
Adding chlorine completes disinfection
Dose first meets water demand; only residual acting over real contact time forms useful exposure.
CT is feed concentration × volume/flow
C is the applicable residual and T reflects short-circuiting; peak-flow tracing matters more than nominal volume.
Higher residual is always safer
Beyond the target it raises byproducts, corrosion, odor, and aquatic toxicity; balance inactivation, distribution protection, and DBPs.
Chlorine works equally on all organisms
Resistance varies widely and particle embedding protects organisms; target-specific barriers are essential.