Illustrated guides · Disinfection, oxidation, and micropollutants
How does ultraviolet light damage microbial DNA?
Germicidal UV absorbed by DNA or RNA mainly creates adjacent-pyrimidine dimers and photoproducts that block correct replication and infectivity.
Direct answer
Direct answer
Water-treatment UV uses germicidal wavelengths. A common low-pressure mercury lamp emits near 254 nm, close to the strong DNA/RNA absorption region near 260 nm. Absorbed photons most commonly create covalent dimers between adjacent pyrimidines on one strand, plus 6-4 photoproducts—not wholesale DNA strand breaks at normal disinfection doses. Replication and transcription machinery cannot correctly pass these lesions, so the organism loses the ability to reproduce and infect even though some metabolism may continue briefly; “inactivation” is more accurate than instant death. Performance depends on the fluence actually delivered to each organism, not whether the lamp is visibly on. Validated dose in a full-scale reactor depends on germicidal intensity/spectrum, flow, UV transmittance (UVT), hydraulics, particle shielding, quartz-sleeve fouling, lamp aging, and sensor condition. UV provides no distribution residual and normally does not remove salts, metals, or most chemicals, so a chemical residual may still be used where network protection is required.
Four conditions make UV inactivation work
Between a glowing lamp and an inactivated organism are light penetration, hydraulic exposure, and trustworthy dose control.
Use wavelengths nucleic acids absorb
DNA/RNA absorb strongly near 260 nm and low-pressure 254 nm is well matched. Polychromatic systems need validated germicidal spectral response; total radiant power is not all useful dose.
Deliver sufficient fluence to every path
Dose is reported in mJ/cm². Real paths differ, so validated relations among intensity, flow, UVT, and reactor configuration replace simple panel intensity times nominal residence.
Prevent shielding and hydraulic bypass
Low UVT, color, turbidity, flocs, and embedded organisms absorb or scatter light; short-circuiting creates low-dose paths. Pretreatment and reactor hydraulics both matter.
Keep lamps, sleeves, sensors, and trips healthy
Fouling, aging, temperature/power faults, and sensor drift reduce or misreport dose. Cleaning, calibration, redundancy, and low-dose flow reduction or shutdown close the loop.
Full-scale UV trains force the whole flow through closed reactors or open channels
Parallel stainless closed vessels occupy the center while a submerged open-channel lamp bank appears at right; valves, controls, sensors, and access keep each path defined.
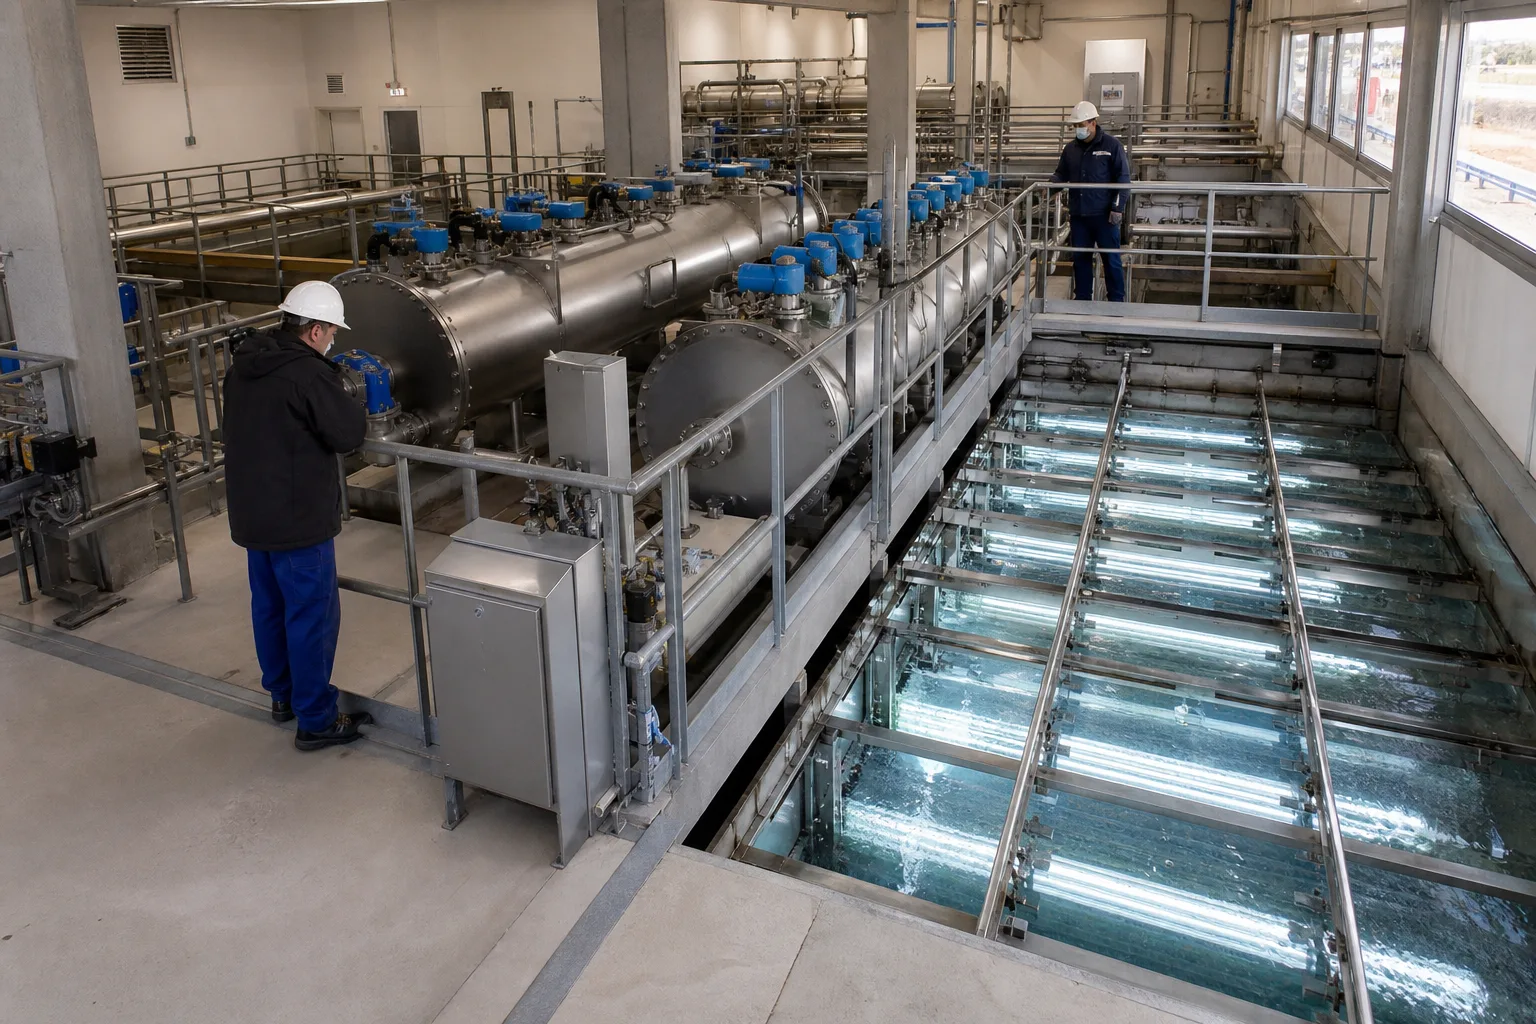 11Parallel closed-vessel UV reactors22Open-channel submerged lamp bank33Isolation valves, flow, and controls44Maintenance platform and safety isolation
What to identify
- 1Parallel closed-vessel UV reactors
- 2Open-channel submerged lamp bank
- 3Isolation valves, flow, and controls
- 4Maintenance platform and safety isolation
Figure takeaway
UV treats continuous flow through a validated light field. Changing online train count, valve position, or flow distribution changes the dose boundary of each reactor.
How to verify it in the field
Verify reactor count, per-unit flow, valve state, UVT, sensor intensity, and operating envelope; test low-dose alarm, flow reduction/trip, bypass lockout, and electrical interlocks before entry.
Bench dose-response work links controlled exposure to inactivation
Identical samples receive controlled UV, while microscopy/molecular displays and paired culture plates compare before and after; pipettes keep sampling consistent.
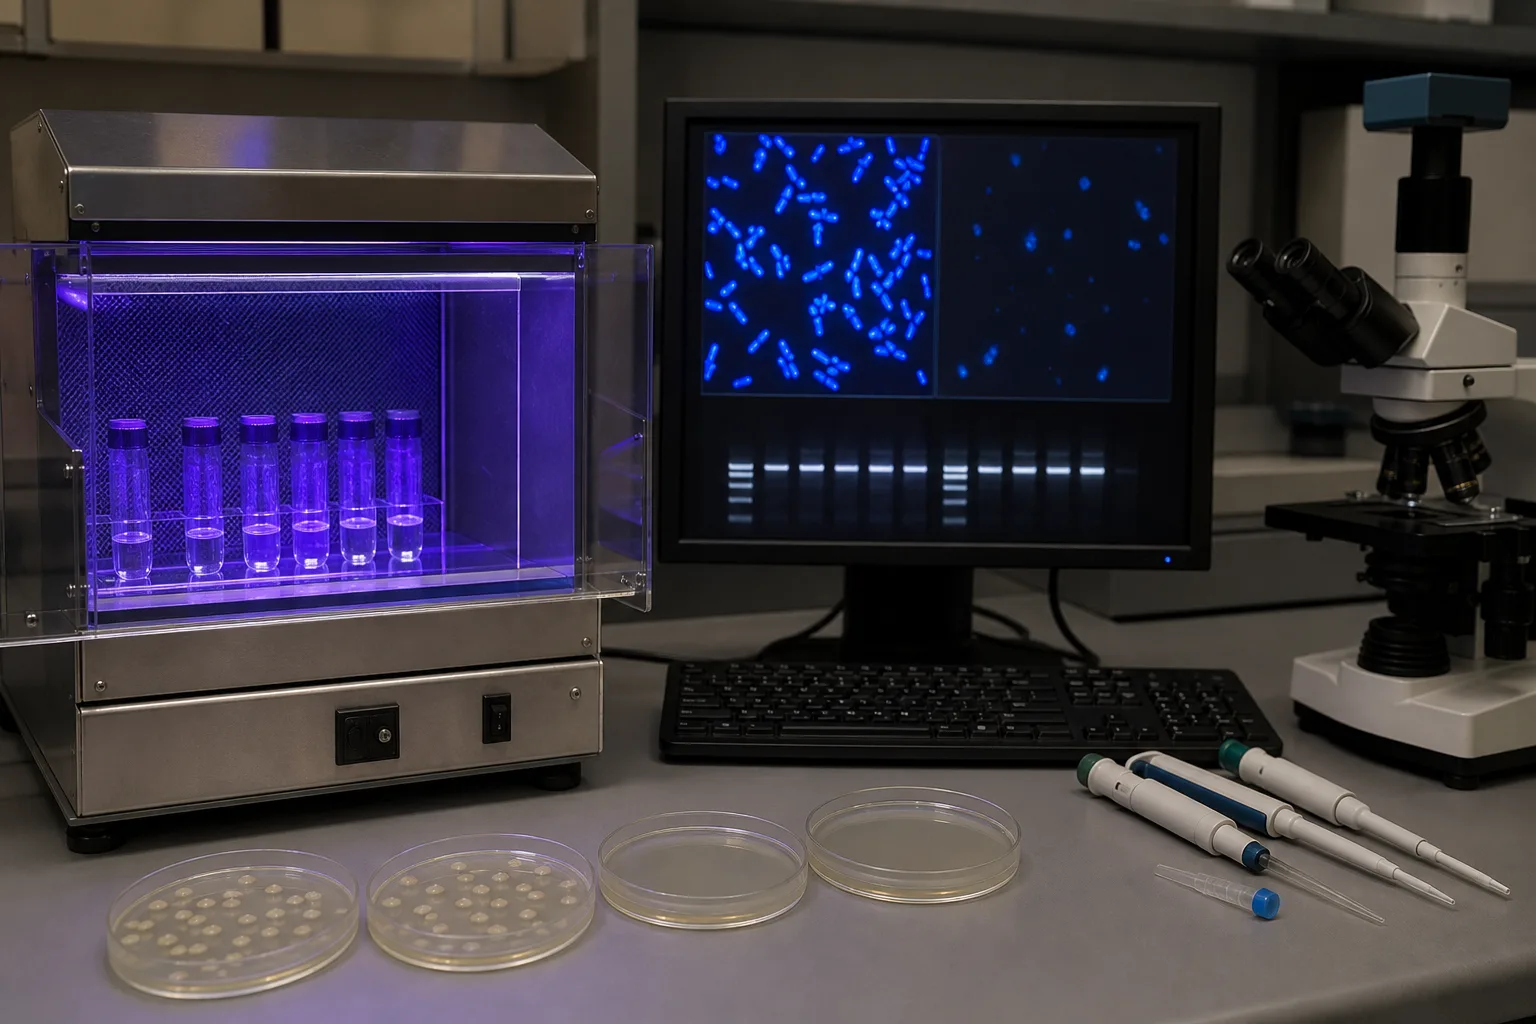 11Controlled UV exposure apparatus22Grouped equal-volume samples33Before/after microscopy or molecular result44Paired culture and quantification
What to identify
- 1Controlled UV exposure apparatus
- 2Grouped equal-volume samples
- 3Before/after microscopy or molecular result
- 4Paired culture and quantification
Figure takeaway
A dose-response curve needs known water, wavelength, average intensity, and exposure time plus an endpoint that represents culturability or infectivity. A vivid fluorescent image is not regulatory log credit.
How to verify it in the field
Document depth, UV absorbance/transmittance, radiometer calibration, field-uniformity correction, exposure, mixing, dark control, recovery, and a target-appropriate endpoint.
A transparent reactor shows how lamps, sleeves, water, and sensors create dose
Lamps sit inside quartz sleeves isolated from water; several cross the flow chamber while a probe reads germicidal intensity and inlet/outlet structures set paths.
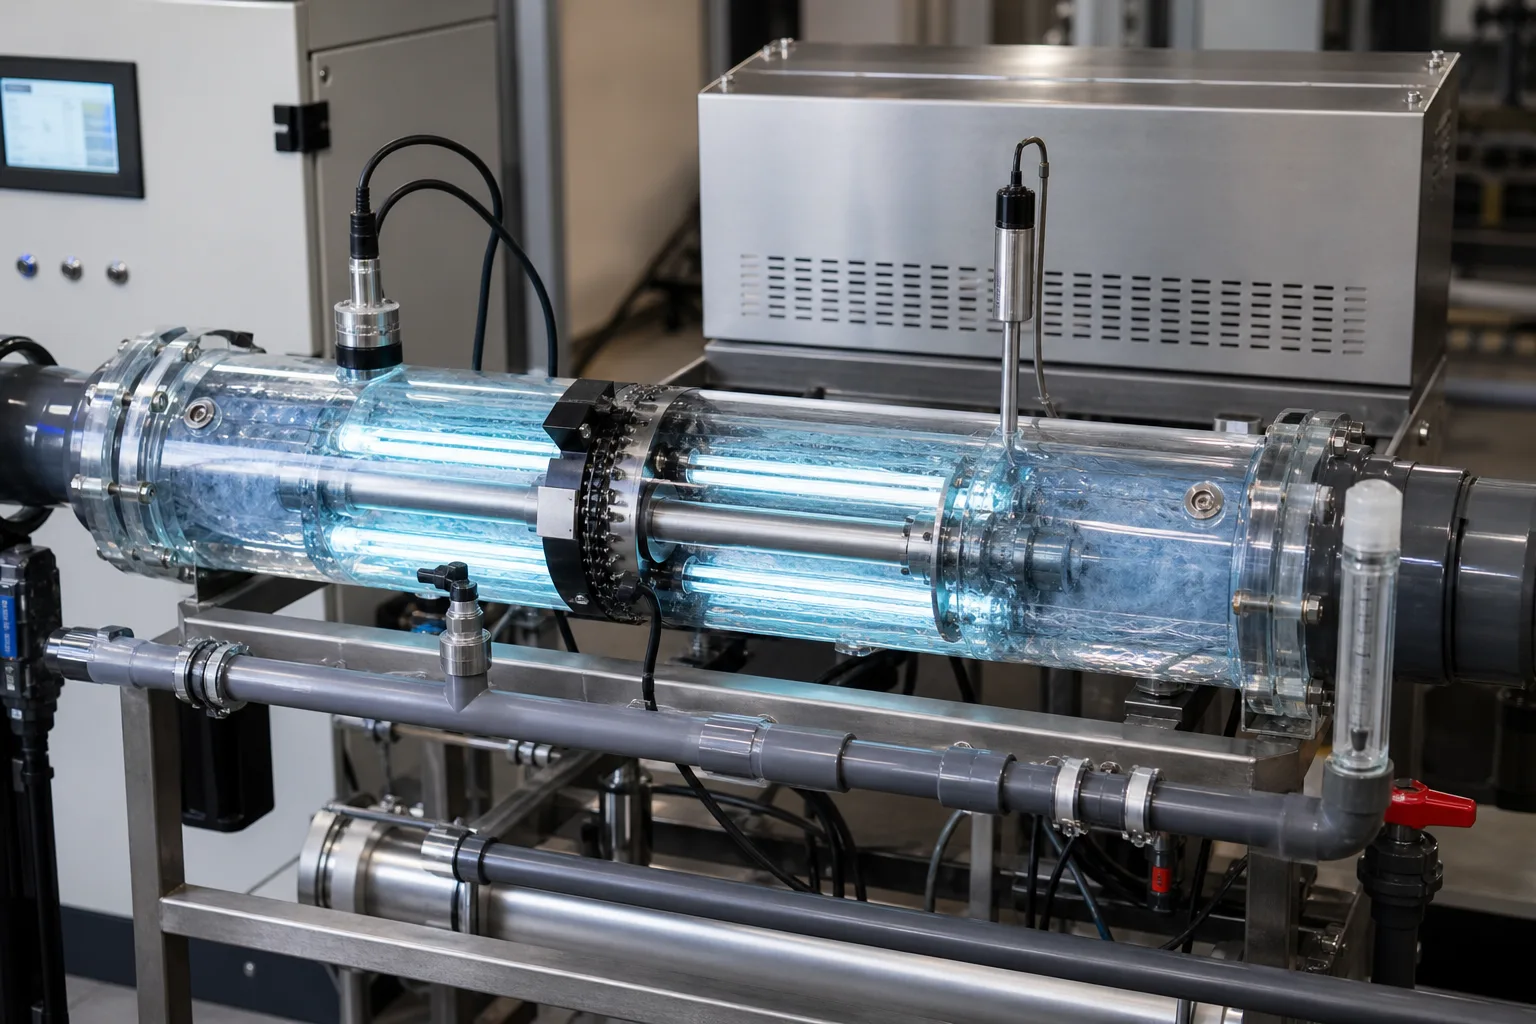 11UV lamp and quartz sleeve22Irradiated flow chamber33Online UV intensity sensor44Inlet, outlet, and hydraulic path
What to identify
- 1UV lamp and quartz sleeve
- 2Irradiated flow chamber
- 3Online UV intensity sensor
- 4Inlet, outlet, and hydraulic path
Figure takeaway
Lamp power is only the source. Sleeve transmission, fouling, water UVT, and flow path each discount what reaches an organism; a lit panel can coexist with inadequate dose.
How to verify it in the field
Compare electrical power with calibrated intensity, trend before/after cleaning, log UVT and per-reactor flow, and verify sensor window, sleeves, baffles, and orientation match validation.
Parallel tests separate underdose, target operation, and excess margin
Small reactors have independent flowmeters; cuvettes and culture plates show light transmission and colony response under different UVT, flow, or intensity.
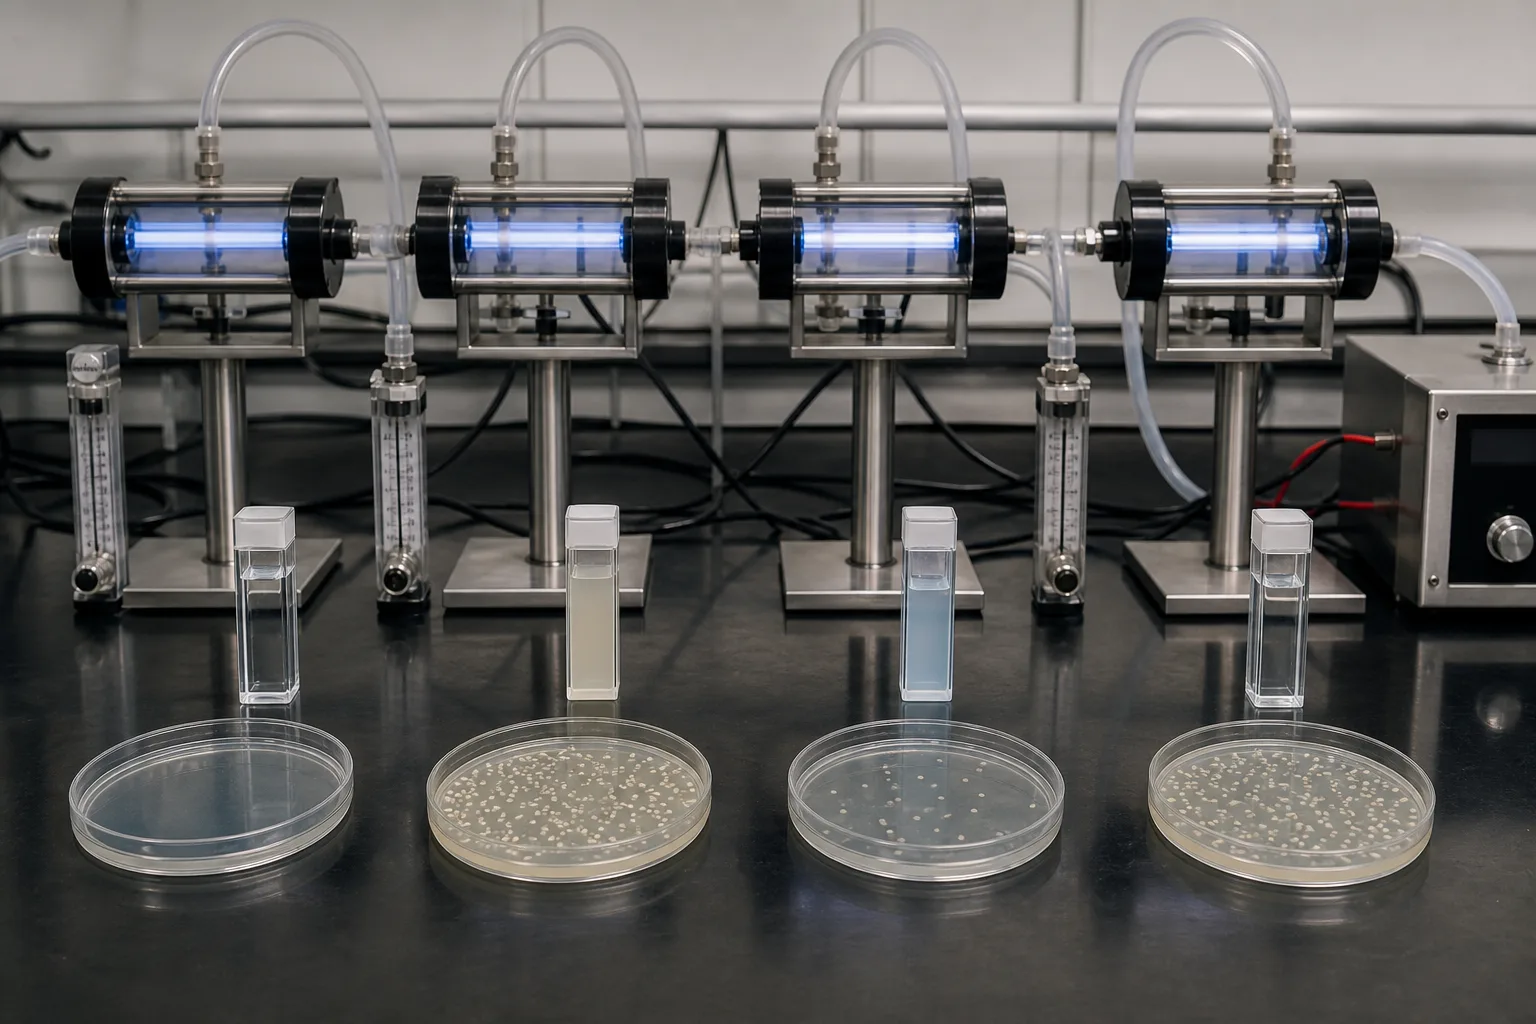 11Different flow/dose reactors22Independent flowmeters and control33UVT/absorbance cuvettes44Dose-response culture plates
What to identify
- 1Different flow/dose reactors
- 2Independent flowmeters and control
- 3UVT/absorbance cuvettes
- 4Dose-response culture plates
Figure takeaway
Underdose can arise from high flow, low intensity, or low UVT. Excess dose adds energy and lamp burden; the target is validated inactivation within the operating envelope, not permanent maximum power.
How to verify it in the field
Measure intensity, UVT, flow, temperature, and response together on the same water. Do not use sample color or one plate as an online dose controller.
Sleeve fouling and lamp aging turn equal electric power into less germicidal light
Technicians compare a clean sleeve, deposited sleeve, removed lamp, seals, and sensor parts after isolating an opened reactor.
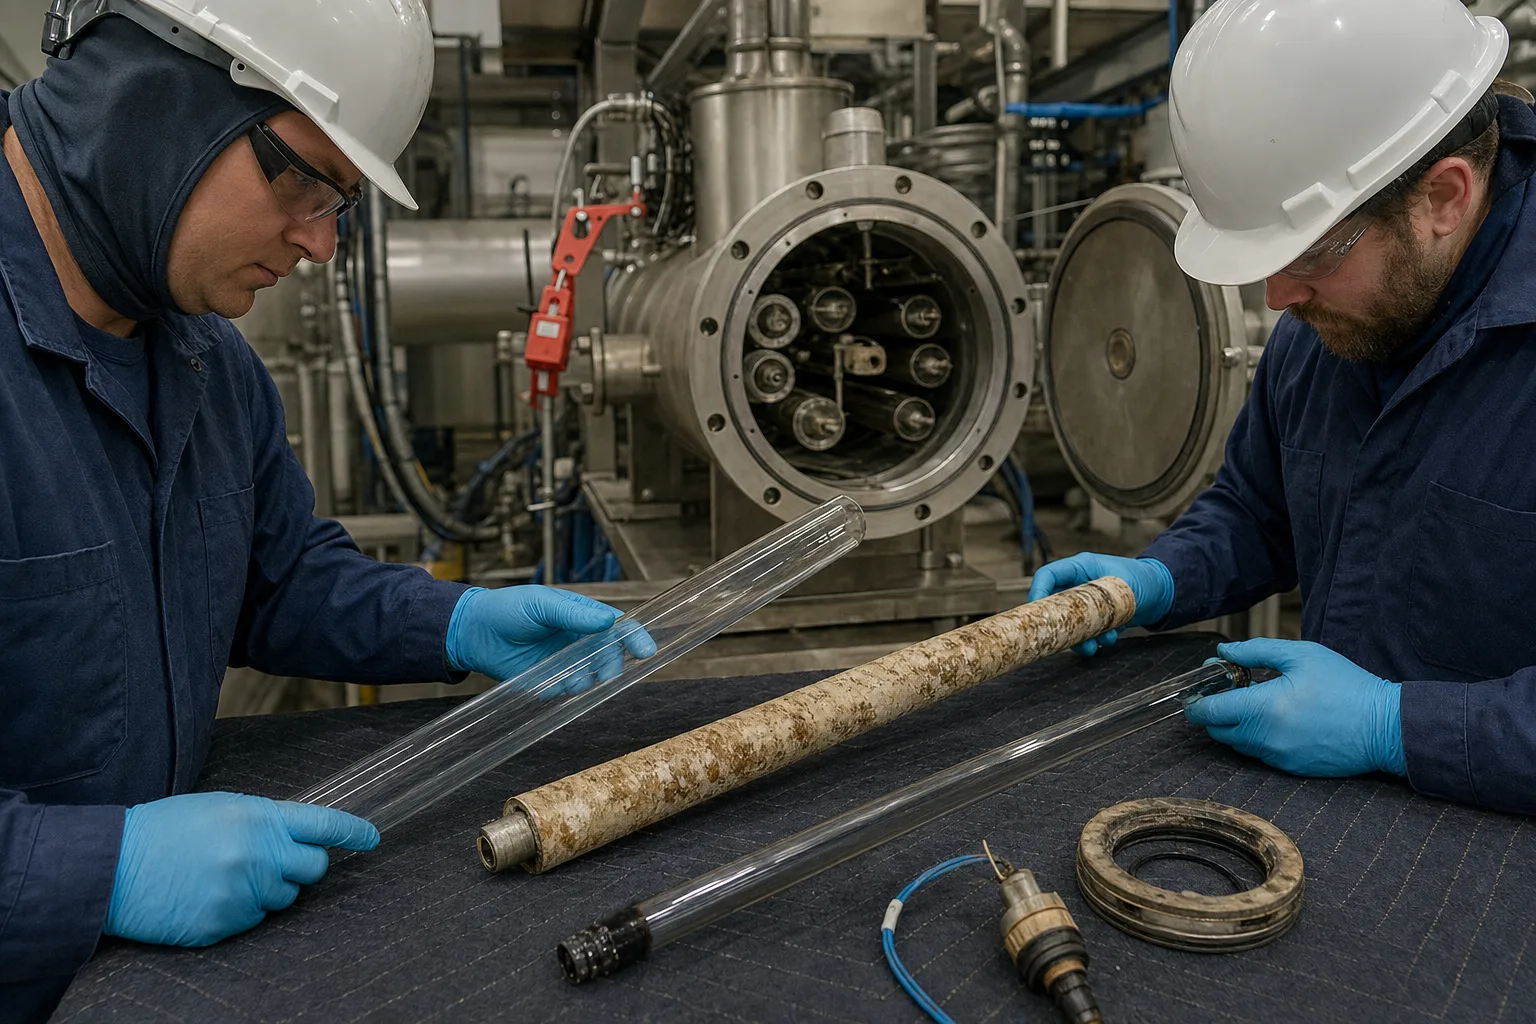 11Clean quartz sleeve22Scaled or biofouled sleeve33UV lamp and end connection44Seals, sensor, maintenance isolation
What to identify
- 1Clean quartz sleeve
- 2Scaled or biofouled sleeve
- 3UV lamp and end connection
- 4Seals, sensor, maintenance isolation
Figure takeaway
Deposits intercept UV before water and lamp output decays with hours and cycling. A falling sensor can mean true output loss or a dirty sensor window, so cleaning, replacement, calibration, and trends must agree.
How to verify it in the field
Use lockout, depressurization, drainage, and cooling; inspect wipers/chemical cleaning, cracks and seals, lamp hours/cycles, intensity recovery, UVT, and sensor reference checks.
Six links from photon to inactivation credit
Every link must hold for displayed dose to represent microbial exposure.
1 Produce germicidal light
Lamp and driver → target UV band
Provide nucleic-acid-absorbed photons.
2 Transmit through sleeve and water
Clean quartz → UVT/absorption/scattering
Set how much light reaches organisms.
3 Equalize exposure
Flow + mixing + reactor hydraulics
Limit low-dose short paths.
4 Nucleic acid absorbs
Roughly 200–300 nm → DNA/RNA
Deposit energy in genetic material.
5 Form photolesions
Pyrimidine dimers / 6-4 products
Block replication and infectivity.
6 Validate and sustain
Bioassay → intensity/UVT/flow monitoring
Turn laboratory response into operating credit.
Four responsibilities in a UV system
Source, water quality, hydraulics, and validated control are inseparable.
Lamp, driver, sleeve
- Role
- Produce stable germicidal light and isolate lamp from water
- Typical failure
- Aging/outage, power fault, sleeve fouling/crack, wiper failure
- Evidence
- Lamp state/hours/current, intensity trend, cleaning recovery, sleeve/seal inspection
Influent water
- Role
- Maintain acceptable UVT, turbidity, color, particle state
- Typical failure
- Absorbance spike, shielding, Fe/Mn/hardness deposit
- Evidence
- UVT, turbidity, color, TSS, Fe/Mn/hardness, pretreatment events
Reactor hydraulics
- Role
- Distribute within validated flow/configuration and limit short-circuiting
- Typical failure
- Over-flow, wrong valves/train count, bubbles, nonvalidated modification
- Evidence
- Per-unit flow, valve state, pressure, train count, validated drawings/tests
Monitoring and validation
- Role
- Use intensity, UVT, flow, and validated algorithm to assess dose
- Typical failure
- Sensor drift, wrong settings, out-of-envelope operation, bypassed alarm
- Evidence
- Calibration, validation report, setting audit, trip tests, event logs
Required dose and log credit come from applicable rules, target organisms, validation reports, and approved operating conditions. Do not copy numbers between reactors, lamp types, or waters. Maintenance requires electrical, pressure, glass, and UV-exposure isolation.
Align three evidence groups on one timeline
Emission and transmission
Lamp state/power/hours, sensor intensity, cleaning and recovery, influent UVT/absorbance, turbidity, color, temperature, and optical water-quality events.
Hydraulics and validated state
Total and per-unit flow, online trains, valves/bypass, pressure, validated dose or RED, envelope limits, alarms, and automatic flow reduction/trip.
Outcome and complete barrier
Target or indicator microbes, upstream filtration, downstream chemical residual if used, energy, cleaning/lamp replacement, downtime, and scheduled performance checks.
Diagnose a low-dose alarm by combined signals
- Combined signal
- Many reactors fall together as UVT/turbidity worsens; cleaning gives little recovery
- Suspect first
- Influent optical deterioration or shielding, not simultaneous lamp aging
- Next step
- Reduce flow/add trains per interlock, confirm offline UVT/turbidity and pretreatment/source event, then reprove dose
- Combined signal
- One sensor slowly falls with stable UVT/flow and rises after cleaning
- Suspect first
- Local sleeve or sensor-window fouling
- Next step
- Compare peer sensors and cleaning response; inspect wiper/cleaning, sleeve, and sensor window before raising plantwide power
- Combined signal
- Intensity is normal but validated dose falls as peak flow, train count, or valves change
- Suspect first
- Per-reactor overload or hydraulic configuration outside validation
- Next step
- Restore validated train/valve state, limit flow, audit unit flow, algorithm settings, and bypass
- Combined signal
- Online dose passes but microbial results are abnormal or inconsistent
- Suspect first
- Sampling/assay issue, particle shielding, hidden bypass, or invalidated assumptions
- Next step
- Check method QC, particles/UVT/turbidity, bypass and event logs, then use an appropriate challenge or independent review
Four common misconceptions
UV mainly cuts DNA strands
At normal water-disinfection doses, adjacent-pyrimidine dimers and related photoproducts dominate; extensive strand breaks need far higher dose.
A lit lamp proves adequate dose
Sleeves, water UVT, hydraulics, flow, aging, and sensors all determine exposure.
UV instantly kills every organism
It mainly prevents replication and infectivity; susceptibility differs and validated design accounts for relevant repair/reactivation boundaries.
UV removes the need for all other disinfection
UV leaves no network residual; a chemical residual may still be required by the system and regulations.