Solutions · Sustainability & ESG
Solvent Recovery & Purification: closed loops for pharma and fine chemical plants
NF/RO, carbon, and distillation hybrids—cutting VOC loss and disposal cost with audit-friendly mass balances.
Use this guide within its scope
This page supports technical research and option comparison and is marked 2026. Illustrative values are not a quotation, completed process design, certification conclusion, or performance guarantee. Check current regulations, feed data, tests, and OEM records.
Problem
Solvent waste is both EHS risk and margin leakage.
Technology
Separation trains matched to azeotropes, polarity, and purity specs.
Results
Tonnes solvent returned to process; fewer truckloads to incineration.
Engineering decision card
Use when
Solvent waste is both EHS risk and margin leakage.
Evaluate first
Separation trains matched to azeotropes, polarity, and purity specs.
Inputs still required
Feed source and variability, capacity, target quality, operating hours, discharge or reuse boundary, available space, and utilities.
Comparison output
Tonnes solvent returned to process; fewer truckloads to incineration. The final decision still needs feed data, mass balance, and any necessary testing.
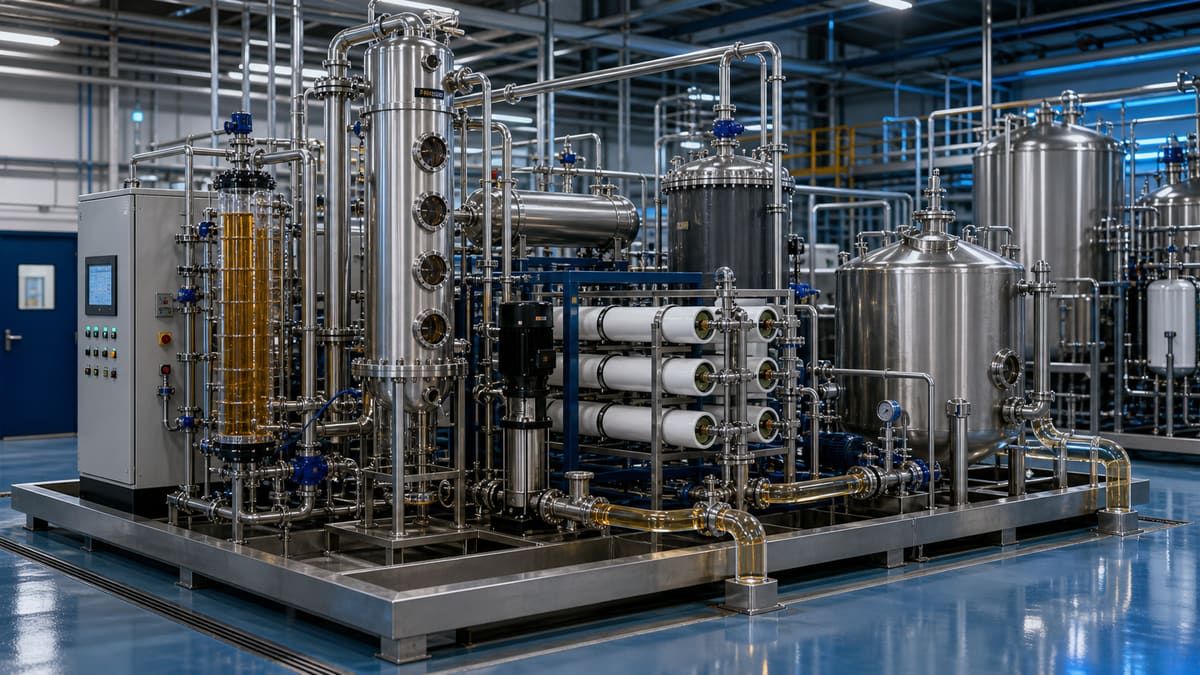
Solvent Recovery & Purification: closed loops for pharma and fine chemical plants
For pharmaceutical and fine chemical sectors, solvent management isn't just an operational cost; it's a critical nexus of environmental responsibility, supply chain resilience, and competitive advantage. The traditional linear model of solvent consumption – procure, use, dispose – is increasingly challenged by stringent environmental regulations, escalating disposal costs, and the volatile price of virgin chemicals. More critically, it exacerbates carbon emissions, contributes to water stress through pollution, and creates significant export-market ESG compliance hurdles for companies targeting UK and EU supply chains by 2026.
Worked energy / carbon sketch
Consider a fine chemical plant currently using significant volumes of virgin solvent and incurring substantial costs for waste solvent disposal. Implementing an this approach solvent recovery system can yield considerable energy and carbon savings.
Let's assume:
- A solvent recovery unit reclaims 2000 litres per hour (L/h) of solvent, operating for 8000 hours per year.
- The energy intensity of reclaiming one litre of solvent via our system is approximately 0.5 kWh/L lower than the combined energy required to produce a virgin litre and treat one litre of waste solvent off-site. (This accounts for energy used in distillation, filtration, and other recovery steps, offset against the energy of virgin production and waste transport/treatment.)
- The grid electricity carbon intensity for the region is 0.233 kg CO₂e/kWh (illustrative EU average for industrial electricity).
Annual Energy Savings Calculation: Annual Volume Recovered = 2000 L/h × 8000 h/year = 16,000,000 L/year Annual Energy Savings = 16,000,000 L/year × 0.5 kWh/L = 8,000,000 kWh/year
Annual Carbon Emissions Reduction Calculation: Annual Carbon Savings = 8,000,000 kWh/year × 0.233 kg CO₂e/kWh = 1,864,000 kg CO₂e/year Converted to tonnes = 1864 tonnes CO₂e/year
This illustrative sketch demonstrates how a well-designed solvent recovery system can significantly reduce both operational energy consumption and scope 1 & 2 carbon emissions, contributing directly to a facility's decarbonisation targets. The avoided logistics for virgin solvent delivery and waste disposal further reduce indirect (Scope 3) emissions.
Traditional vs engineering evaluation path
| Traditional solvent management | engineering evaluation path solvent recovery |
|---|---|
| Linear: virgin purchase, single pass, off-site disposal; volatile cost and heavy waste paperwork. | Closed loop: distill / membrane / carbon trains matched to chemistry; reuse on spec. |
| Weak mass balance; hard to prove Scope 3 and chemical intensity to buyers. | Metered inputs/outputs and kWh per tonne recovered—better fit for ESG questionnaires. |
Integrating robust solvent recovery into your operations is a foundational step in water stewardship and responsible resource management. By implementing metering on solvent inputs, recovered outputs, and waste streams, facilities gain a precise understanding of their material balance. This meticulous data collection, covering both mass and energy consumption for recovery, directly supports the granular reporting required for leading ESG frameworks such as CDP (Carbon Disclosure Project) and the Alliance for Water Stewardship (AWS) Standard. Documented mass and energy balances provide objective evidence of efficiency gains, waste reduction, and decarbonisation efforts, enabling transparent and credible disclosure to stakeholders without resorting to unsubstantiated claims.
Carbon savings calculator (illustrative)
Estimate annual electricity savings and avoided CO₂e when specific energy improves (e.g. after ERD, VFD tuning, or train optimization). Replace defaults with your meter data and your grid emission factor from your utility or ESG methodology.
ΔkWh/year ≈ Q(m³/h) × hours/year × (kWh/m³before − kWh/m³after) · tCO₂e ≈ ΔkWh × factor / 1000
Δ specific energy: 1.00 kWh/m³
Estimated electricity savings: 800,000 kWh/year
Indicative avoided emissions: 336 tCO₂e/year
Related equipment & product lines
These categories typically support the approach above—open any line to compare brands and models.
- ChemicalsAntiscalants, cleaners, and process chemicals for water treatment operations.View category →
- Activated CarbonPowdered and granular activated carbon (PAC/GAC) for adsorption of organics, odor, and trace contaminants.View category →
- UF ModulesUltrafiltration modules for suspended solids and colloid removal.View category →
For a closer review, use the engineering inquiry form to share feed, capacity, target, and project stage. Submission does not constitute a completed design or performance commitment.