Solutions · Sustainability & ESG
Phosphorus Recovery (Struvite): turning municipal nutrients into slow-release fertilizer
Controlled precipitation, reactor design, and fertilizer pathways—cutting chemical P load and struvite scaling elsewhere in the plant.
Use when
Phosphorus in effluent is both a pollutant and a lost resource; struvite fouls pipes if uncontrolled.
Process options
Engineered supersaturation, seeding, and dewatering with quality specs for reuse markets.
Assessment output
Evaluate downstream chemical savings and product quality, approvals and buyers for a potential recovered-fertilizer stream.
Inputs and conditions for an assessment
Collect feed variability, capacity, target quality, operating hours, discharge or reuse boundaries and installed equipment data. Compare examples on matched conditions and meter boundaries; assess a project using actual water data, equipment documentation and any necessary tests.
View the process illustration
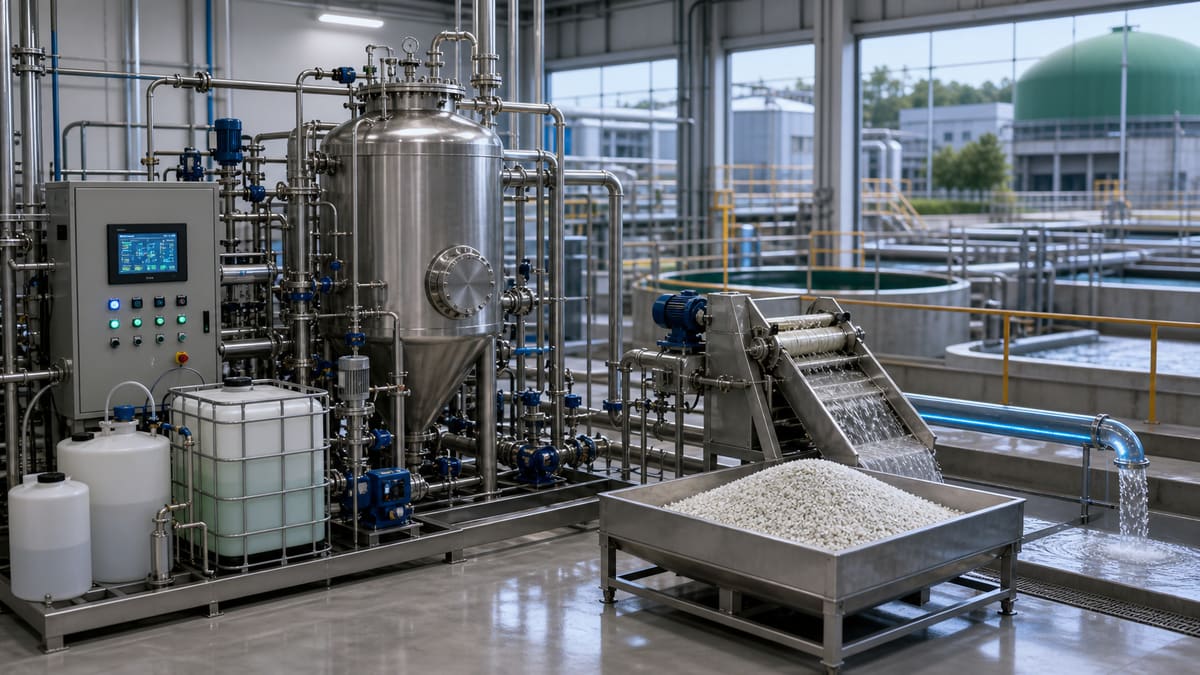
Phosphorus Recovery (Struvite): turning municipal nutrients into slow-release fertilizer
Phosphorus is an essential nutrient, critical for global food security, yet it is a finite, non-renewable resource facing geopolitical supply chain risks. Simultaneously, phosphorus discharged into waterways from municipal wastewater treatment plants (WWTPs) contributes to eutrophication, a significant water quality issue that disrupts aquatic ecosystems and can increase water treatment costs for downstream users. This dual challenge – resource scarcity and environmental pollution – positions phosphorus recovery as a strategic imperative for industries and municipalities alike.
The transition towards a circular economy in the UK and EU is accelerating, driven by ambitious net-zero targets, tightening environmental regulations, and robust ESG (Environmental, Social, and Governance) reporting frameworks. Industrial buyers and EPCs operating within these supply chains are increasingly scrutinised on their resource efficiency, waste valorisation, and carbon footprints. Recovering phosphorus, particularly through struvite precipitation, offers a potent solution to address these pressures. By converting a waste product into a valuable, slow-release fertiliser, organisations may reduce nutrient discharge and improve resource circularity. Carbon effects and revenue depend on recovery inputs, fertilizer substitution, product acceptance and actual markets; assess these separately rather than assuming a net benefit.
The Mechanism of Struvite Precipitation
Struvite (magnesium ammonium phosphate, MgNH₄PO₄·6H₂O) is a naturally occurring crystal that can be selectively precipitated from nutrient-rich wastewater streams. The process involves optimising pH and introducing magnesium ions (e.g., from magnesium chloride or magnesium hydroxide) into phosphorus-rich effluents. Controlled supersaturation can form struvite crystals for dewatering. Purity, contaminants, permitted feedstocks and applicable fertilizer-product requirements must be checked before sale as a slow-release fertilizer. This not only removes phosphorus from the wastewater, helping meet discharge limits, but also simultaneously reduces ammonia, contributing to overall effluent quality.
Worked energy / carbon sketch
Recovered struvite may displace virgin phosphate fertilizer where agronomic performance and actual use support substitution. The following municipal wastewater treatment plant (WWTP) example calculates a gross avoided-production scenario; net effects also require recovery energy, chemicals, transport and the baseline.
Assumptions (Illustrative):
- A WWTP recovers 250 kg of elemental phosphorus (P) per day as struvite.
- This recovered P is equivalent to approximately 573 kg of P₂O₅ per day (1 kg P ≈ 2.29 kg P₂O₅).
- Assume 2.5 kg CO₂e per kg of P₂O₅ for displaced fertilizer production solely for this arithmetic example; this is not a verified industry-average factor and must be replaced by applicable life-cycle data.
- The system operates 350 days per year.
Calculation:
- Annual P₂O₅ recovery: 573 kg P₂O₅/day × 350 days/year = 200,550 kg P₂O₅/year
- Gross avoided-production CO₂e: 200,550 kg P₂O₅/year × 2.5 kg CO₂e/kg P₂O₅ = 501,375 kg CO₂e/year
- Annual gross avoided-production estimate (tonnes CO₂e): 501,375 kg CO₂e/year ÷ 1000 kg/tonne = 501.4 tonnes CO₂e/year
Under the stated assumptions and rounded daily equivalent, recovering 250 kg of phosphorus daily gives a gross avoided-production estimate above 500 tonnes of CO₂e annually. This is not net project savings: account for recovery energy and chemicals, transport, usable product and the actual substitution baseline. Report avoided emissions separately from Scope 1, Scope 2 and Scope 3 inventories.
Chemical phosphorus removal vs struvite recovery
| Topic | Chemical P removal + sludge disposal | Struvite recovery |
|---|---|---|
| Outcome | P shifted to sludge; landfill/incineration; limited circularity. | Potential slow-release product, subject to quality, approval and actual use. |
| OPEX | Metal salts, hauling wet cake, rising disposal fees. | Compare Mg, reactor, dewatering and quality-control OPEX with verified product income and maintenance savings. |
| ESG | Compliance-first narrative. | Quantified P recovery (t/y) for circular-economy disclosures. |
Integrating Phosphorus Recovery into Water Stewardship and ESG Disclosure
Implementing struvite recovery technology is a tangible step towards holistic water stewardship. By meticulously monitoring and documenting the mass balance of phosphorus entering and exiting your facility, alongside the energy and chemical inputs for recovery, organisations can generate robust, auditable data. This granular data is invaluable for ESG questionnaires and reporting frameworks like CDP (Climate Change, Water Security, Forests) and the Alliance for Water Stewardship (AWS) Standard.
Such data-driven insights allow for clear articulation of how your operations are:
- Reducing water quality impacts: Quantifying phosphorus removal and its effect on local ecosystems.
- Enhancing resource circularity: Documenting tonnes of phosphorus recovered and diverted from waste streams, demonstrating progress towards a circular economy.
- Mitigating climate risk: Assessing actual energy and value-chain inventory changes, while reporting fertilizer-substitution avoided-emissions scenarios separately from Scope 3 inventories.
- Improving operational resilience: Highlighting reduced reliance on external, potentially volatile phosphorus markets.
This rigorous approach ensures that sustainability claims are backed by verifiable metrics, lending credibility and fostering trust with stakeholders—from investors to regulators and supply chain partners.
References: EU: requirements for precipitated phosphate salts in fertilizing products; GHG Protocol: inventory and project accounting are distinct.
Carbon savings calculator (illustrative)
Estimate annual changes in electricity use and CO₂e emissions from specific energy before and after a change. Replace defaults with site meter data and the grid emission factor required by your utility or ESG methodology.
Annual electricity reduction = flow × annual operating hours × (specific energy before − after). Emissions reduction = electricity reduction × grid factor / 1000. Negative values indicate an increase.
ΔkWh = Q × H × (SEC₀ − SEC₁) · ΔtCO₂e = ΔkWh × EF / 1000
Specific energy reduction: 1.00 kWh/m³
Estimated electricity savings: 800,000 kWh / year
Indicative avoided emissions: 336 tCO₂e / year
Related equipment & product lines
These categories typically support the approach above—open any line to compare brands and models.
- ChemicalsAntiscalants, cleaners, and process chemicals for water treatment operations.View category →
- Statiflo Static MixersStatic mixing components for inline chemical dosing and blending.View category →
- Pumps & PumpingHigh-pressure and process pump solutions for water treatment skids and plants.View category →
For a closer review, use the engineering inquiry form to share feed, capacity, target, and project stage. Submission does not constitute a completed design or performance commitment.