Solutions · Sustainability & ESG
RO energy recovery: assess brine pressure and flow
Separate SWRO from BWRO and existing-ERD upgrades from a no-ERD baseline; calculate savings using brine conditions and a consistent specific-energy boundary.
Use when
Pressurized concentrate carries recoverable energy, but the available amount depends on brine flow, pressure and the installed equipment.
Process options
Match an isobaric or turbine ERD to the pressure and flow range, then assess pumps, boosting and controls as an integrated system.
Assessment output
Compare high-pressure energy, total-system SEC and retrofit cost at the same product-water flow and quality.
Inputs and conditions for an assessment
Collect feed variability, capacity, target quality, operating hours, discharge or reuse boundaries and installed equipment data. Compare examples on matched conditions and meter boundaries; assess a project using actual water data, equipment documentation and any necessary tests.
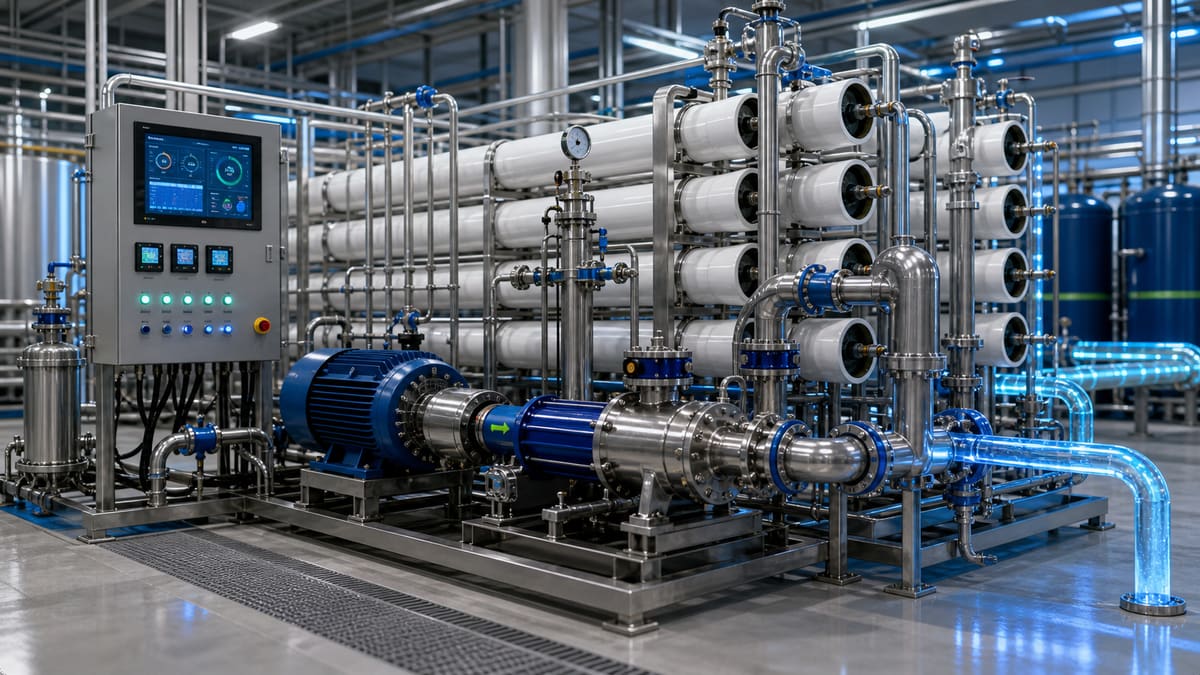
View the process illustration
Identify the recoverable pressure energy
An ERD uses RO concentrate pressure to help pressurize feed water. Measure brine flow and pressure before assessing hydraulic power, equipment range and integration losses.
High-pressure seawater and lower-pressure brackish/reuse systems have different opportunities. Energy Recovery describes low-pressure PX savings as up to about 30% against a system without an ERD. That potential upper value does not establish a minimum 30% saving for every RO system. Upgrading an existing ERD requires comparison with its measured baseline.
| Input | Purpose |
|---|---|
| Brine flow and inlet/outlet pressure | Estimate recoverable pressure energy |
| Existing pumps, ERD models and efficiency | Establish the baseline |
| Product flow and quality | Hold comparison conditions constant |
| High-pressure and whole-system meter boundaries | Distinguish local savings from total SEC |
| Operating hours, tariff, retrofit and maintenance costs | Estimate annual expense and payback |
At otherwise equal conditions, higher recovery reduces concentrate flow. Higher recovery alone therefore does not establish a larger ERD benefit.
An assumed-SEC calculation
This is arithmetic using assumed SEC values, not a performance prediction for a particular RO application. Assume 100m³/h production for 8,000h/year, with SEC changing from 4.0 to 2.5kWh/m³ at the same quality. An illustrative emissions factor of 0.20kg CO₂e/kWh is used only for the calculation.
| Calculation | Result |
|---|---|
| Annual production: 100×8,000 | 800,000m³/year |
| Assumed SEC difference: 4.0−2.5 | 1.5kWh/m³ |
| Assumed reduction: 1.5÷4.0 | 37.5% |
| Annual energy difference: 800,000×1.5 | 1,200,000kWh/year |
| Using the illustrative factor | 240t CO₂e/year |
For a project, replace assumptions with measurements or a named equipment proposal on a consistent meter boundary and use the applicable emissions factor. If SEC rises, report an energy increase rather than zero savings.
Compare and verify a retrofit
Record pressure, brine flow, product flow, quality, pump input power and ERD configuration for both options. Measure high-pressure and total-system SEC separately. Calculate payback from net annual expense savings and the complete installed cost rather than a generic one-to-three-year promise.
Include stable operation, startup/shutdown and load changes in acceptance checks. Verify pressure and flow ranges, boost requirements, materials and control compatibility.
Original references
Carbon savings calculator (illustrative)
Estimate annual changes in electricity use and CO₂e emissions from specific energy before and after a change. Replace defaults with site meter data and the grid emission factor required by your utility or ESG methodology.
Annual electricity reduction = flow × annual operating hours × (specific energy before − after). Emissions reduction = electricity reduction × grid factor / 1000. Negative values indicate an increase.
ΔkWh = Q × H × (SEC₀ − SEC₁) · ΔtCO₂e = ΔkWh × EF / 1000
Specific energy reduction: 1.00 kWh/m³
Estimated electricity savings: 800,000 kWh / year
Indicative avoided emissions: 336 tCO₂e / year
Related equipment & product lines
These categories typically support the approach above—open any line to compare brands and models.
- Pumps & PumpingHigh-pressure and process pump solutions for water treatment skids and plants.View category →
- InvertersVariable-frequency drives and inverter systems for variable-speed motor control.View category →
- RO MembranesReverse osmosis membrane elements for municipal and industrial desalination.View category →
For a closer review, use the engineering inquiry form to share feed, capacity, target, and project stage. Submission does not constitute a completed design or performance commitment.