Solutions · Sustainability & ESG
UV and Ozone Disinfection: managing chlorinated by-product risk
Targeted UV dose and controlled ozone contact—when they replace or reduce chlorine, and how to document residual strategy for regulators.
Use when
Chlorination by-products and chemical handling burden push buyers toward non-chlorine barriers.
Process options
Validated dose, redox/ORP monitoring, and safety interlocks.
Assessment output
Lower chemical storage and truck traffic; clearer ESG chemical-intensity metrics.
Inputs and conditions for an assessment
Collect feed variability, capacity, target quality, operating hours, discharge or reuse boundaries and installed equipment data. Compare examples on matched conditions and meter boundaries; assess a project using actual water data, equipment documentation and any necessary tests.
View the process illustration
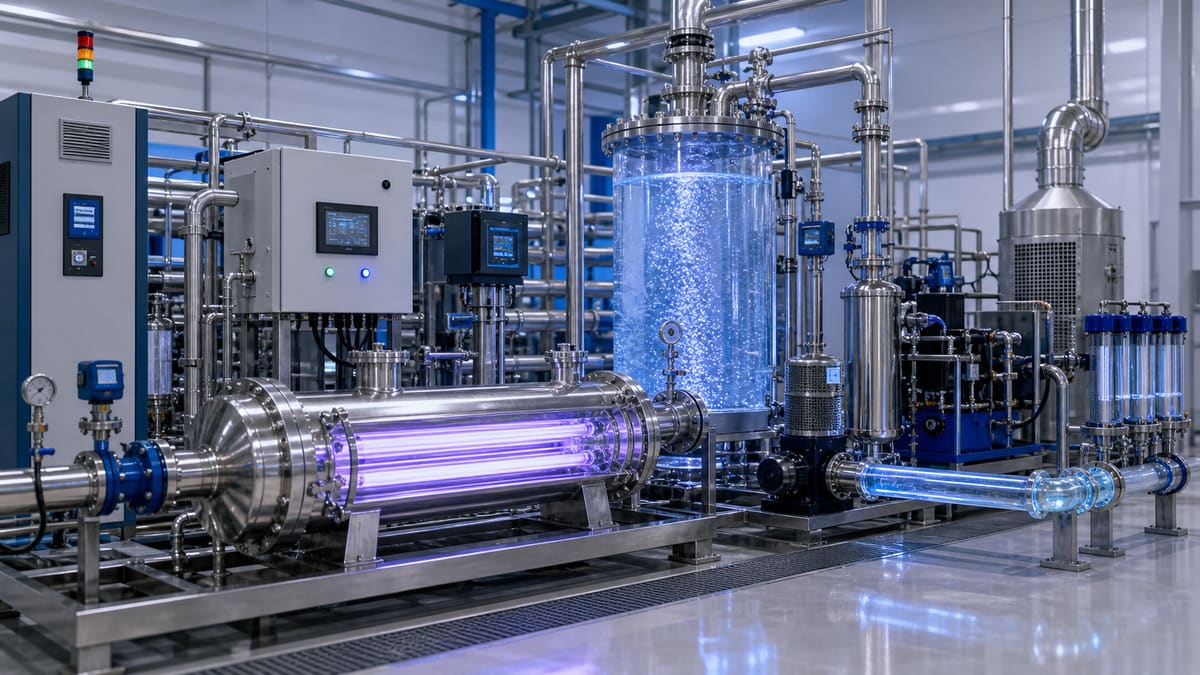
UV and Ozone Disinfection: Managing Chlorinated By-Product Risk
In an era defined by intensifying climate action and mounting water scarcity, industrial operations face unprecedented pressure to demonstrate environmental stewardship. The global drive towards decarbonisation and circularity intersects critically with water management, especially in regions like the EU and UK, where discerning buyers and regulatory bodies impose stringent ESG (Environmental, Social, and Governance) requirements across supply chains. Water is not just a resource; it's a strategic asset and a significant vector for both risk and opportunity.
Compare chlorine, UV and ozone against the required microbial barrier, storage/distribution residual, water chemistry, operator safety and actual energy/chemical use. Ozone is a chemical oxidant generated on site, not chemical-free disinfection. Neither UV nor ozone normally provides a persistent distribution residual, so a downstream residual strategy may still be needed.
The Problem with Chlorinated By-Products
Chlorine can react with natural organic matter (NOM) to form disinfection by-products (DBPs), including trihalomethanes (THMs) and haloacetic acids (HAAs). Assess the actual compounds, applicable water-use limits and risk controls; there is no single globally decreasing limit or universal requirement for a particular post-treatment.
UV can inactivate target microorganisms at validated dose, flow and transmission. Ozone performance depends on residual concentration, contact time, demand, temperature and target organisms. It may form bromate and other oxidation products; its decay to oxygen does not make every product harmless. Reducing chlorine may reduce selected chlorinated by-products but does not eliminate all DBPs or automatically establish compliance.
Worked energy / carbon sketch
Consider an industrial facility processing 1,000 m³/day (approx. 42 m³/hour) of process water, currently relying on significant chlorine dosing followed by an energy-intensive activated carbon filtration system and periodic membrane cleaning to manage disinfection by-products (DBPs) and maintain water quality for discharge.
Illustrative Scenario:
- Current State (Chlorination + DBP Management):
- Chlorine dosing pump energy: 0.005 kWh/m³
- Activated carbon filtration (pumping, regeneration, backwash): 0.05 kWh/m³
- Energy for post-treatment chemical dosing (e.g., dechlorination, pH adjustment): 0.01 kWh/m³
- Total operational energy (Chlorine-related): 0.065 kWh/m³
- Proposed State (Illustrative UV/Ozone System):
- UV/Ozone disinfection system energy: 0.15 kWh/m³ (Higher direct energy use for disinfection)
- Assumed omission of activated carbon and post-treatment chemical dosing for this limited calculation only. Actual organics, byproducts and residual strategy may still require these steps.
- Total operational energy (UV/Ozone): 0.15 kWh/m³
In this specific scenario, a direct comparison of on-site operational energy for disinfection and DBP management shows a potential increase in electricity consumption by 0.085 kWh/m³. However, this narrow view misses critical elements of the broader carbon footprint and compliance benefits.
The life-cycle items to measure separately include:
- Chemical production and transport: Avoiding 15 kg of chlorine per day and ~15 kg CO₂e/day are illustrative assumptions, not a measured conversion factor. Determine actual supplier, production and freight data, plus any replacement chemicals or oxygen supply.
- Downstream treatment: Test whether the proposed barrier changes organic/byproduct treatment demand; ozone can increase biodegradable organics and does not inherently remove that treatment.
- Compliance and safety: Verify microbial reduction, byproduct limits, distribution quality, ozone containment/destruction and electrical interlocks. Avoided fines are not a carbon credit.
The direct electricity comparison below does not establish a lower overall footprint. Combine measured chemical, energy, oxygen, post-treatment and residual impacts within a consistent life-cycle boundary before deciding whether there is a net benefit:
- Net change in operational energy: (0.15 kWh/m³ - 0.065 kWh/m³) = +0.085 kWh/m³ (increase in direct electricity).
- Annual Operation: Assuming 330 days/year (for maintenance).
- Annual water volume: 1,000 m³/day * 330 days/year = 330,000 m³/year.
- Annual net energy change: 330,000 m³/year * 0.085 kWh/m³ = +28,050 kWh/year.
Carbon Footprint Impact: Using the hypothetical factor 0.25 kg CO₂e/kWh, not a verified EU/UK grid value for a stated year: Annual CO₂e impact = 28,050 kWh/year * 0.25 kg CO₂e/kWh = 7,012.5 kg CO₂e/year = 7.01 tonnes CO₂e/year increase in direct electricity emissions.
The direct-electricity increase is not proven to be offset. Even the assumed daily avoided chemical emissions do not by themselves establish a net annual reduction. Complete the measured life-cycle comparison and treatment acceptance before claiming lower carbon, cleaner discharge or compliance.
Chlorination and UV/Ozone Barrier Comparison
| Topic | Chlorine + DBP management to assess | UV / ozone barrier to assess |
|---|---|---|
| Chemistry | Measure chemical use, contact conditions, residuals and DBPs. | Validate UV dose and ozone residual/contact performance; kWh/m³ alone is not disinfectant dose. |
| Safety | Assess storage, chemical handling and containment. | Assess ozone leaks/off-gas destruction, electrical interlocks and any backup chemicals. |
| ESG | Record chemical, transport, energy and residual impacts. | Compare full energy, oxygen, chemicals and verified treatment outcomes. |
Water Stewardship and Disclosure
Meter electricity, water flow, chemicals and oxygen supply and test microbial/byproduct performance. Record actual reductions and added burdens within the chosen boundary. These data can support water and ESG reporting, but do not prove elimination of all DBPs or automatic regulatory acceptance.
References
Carbon savings calculator (illustrative)
Estimate annual changes in electricity use and CO₂e emissions from specific energy before and after a change. Replace defaults with site meter data and the grid emission factor required by your utility or ESG methodology.
Annual electricity reduction = flow × annual operating hours × (specific energy before − after). Emissions reduction = electricity reduction × grid factor / 1000. Negative values indicate an increase.
ΔkWh = Q × H × (SEC₀ − SEC₁) · ΔtCO₂e = ΔkWh × EF / 1000
Specific energy reduction: 1.00 kWh/m³
Estimated electricity savings: 800,000 kWh / year
Indicative avoided emissions: 336 tCO₂e / year
Related equipment & product lines
These categories typically support the approach above—open any line to compare brands and models.
- UV DisinfectionUV systems and modules for pathogen inactivation and final disinfection barriers.View category →
- Ozone GeneratorOzone generation systems and peripherals for advanced oxidation processes.View category →
- Instrumentation & SensorsInstruments and sensors for online monitoring of flow, level, pressure, temperature, and water quality.View category →
For a closer review, use the engineering inquiry form to share feed, capacity, target, and project stage. Submission does not constitute a completed design or performance commitment.