Solutions · New Technologies & Innovation
AI-Powered Membrane Autopsy: ML-assisted SEM/EDS patterning to fingerprint foulant taxonomy
Feature extraction, labeled coupon libraries, and how computer vision shortens root-cause meetings—without replacing chemists.
Use when
Autopsies are slow; plants repeat the same CIP recipe because taxonomy is anecdotal.
Process options
Structured image sets, semi-supervised labels, and human-in-the-loop sign-off for maintenance actions.
Assessment output
Test analyst time, classification errors and maintenance outcomes on independently held-out membrane samples.
Inputs and conditions for an assessment
Collect feed variability, capacity, target quality, operating hours, discharge or reuse boundaries and installed equipment data. Compare examples on matched conditions and meter boundaries; assess a project using actual water data, equipment documentation and any necessary tests.
View the process illustration
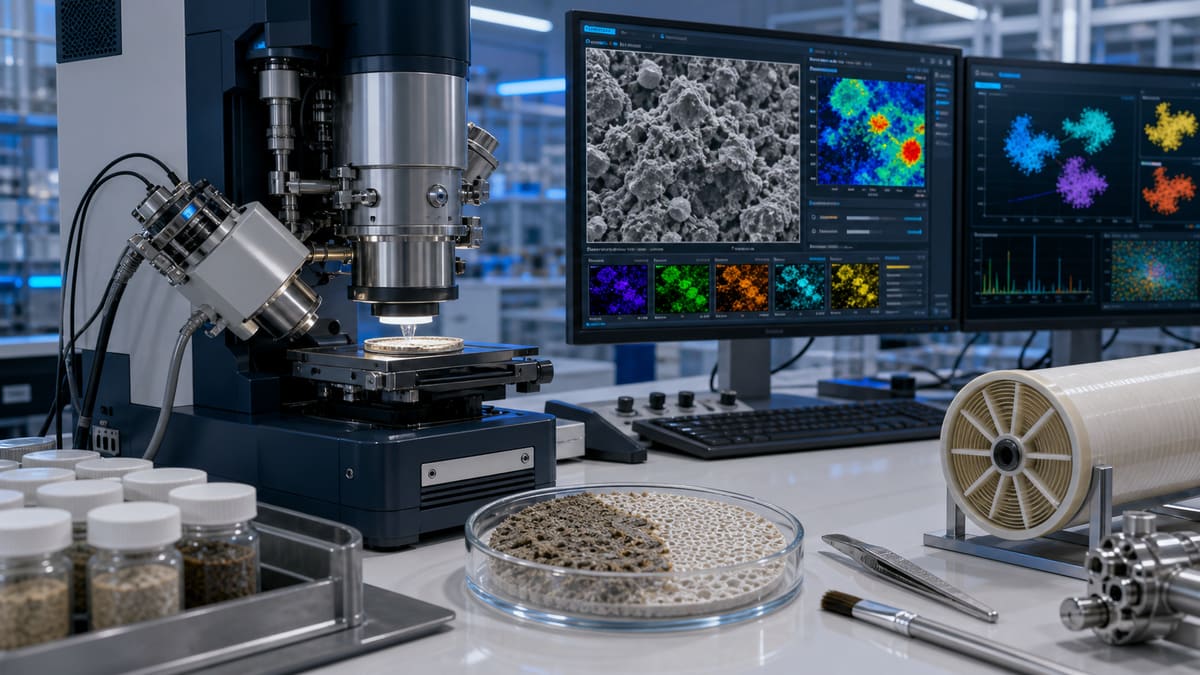
AI-Powered Membrane Autopsy: ML-assisted SEM/EDS patterning to fingerprint foulant taxonomy
Membrane autopsy combines operating history, representative sampling and laboratory characterization to investigate fouling or damage. Machine Learning (ML) may assist image review and pattern organization from Scanning Electron Microscopy (SEM) and Energy-Dispersive X-ray Spectroscopy (EDS). It does not turn elemental similarity into a proven compound identity or root cause. Engineers planning 2026 maintenance programs should validate the workflow against independent samples and expert conclusions before using it to change Cleaning-In-Place (CIP), pretreatment or membrane selection.
Understanding Membrane Fouling: The First-Principles of Resistance and Characterization
Fouling changes transport and hydraulic resistance, while salt passage can also reveal chemical or mechanical damage. The resistance-in-series expression below approximates flux under defined conditions; it is not an autopsy classifier. Use consistent SI units when calculating, converting reported bar and L/m^2$$\cdoth, and evaluate the dense RO layer and porous support separately.
Where:
- is the permeate flux (L/m^2$$\cdoth).
- is the applied transmembrane pressure (bar).
- is the osmotic pressure difference across the membrane (bar).
- is the permeate viscosity (Pas).
- is the intrinsic hydraulic resistance of the clean membrane (m).
- is the additional hydraulic resistance due to fouling (m).
The term summarizes applicable deposit resistance. Cake buildup, adsorption and porous-support blockage differ from transport through a dense RO selective layer. Concentration polarization raises membrane-surface solute concentration and the osmotic difference , reducing driving force at fixed . An ideal dilute-solution osmotic estimate cannot identify a foulant or substitute for a nonideal brine model. Distinguish organic, mineral, colloidal and biological evidence using complementary tests.
Visual inspection, deposit mass and chemical extraction provide useful evidence alongside SEM morphology and EDS elemental maps. Calcium (Ca), Magnesium (Mg), Silicon (Si), Aluminum (Al), Phosphorus (P), Sulfur (S) and Iron (Fe) may appear in several different deposits. Carbon from the membrane, coating or mounting and instrument-dependent light-element sensitivity complicate interpretation. Elemental maps alone do not identify a mineral phase, organic compound or live biological activity; use appropriate chemical, spectroscopic or biological confirmation.
The Dawn of AI-Driven Foulant Fingerprinting
The workflow typically involves:
- Automated Image Acquisition: Standardized protocols for SEM imaging and EDS mapping across membrane samples, ensuring consistent data quality and scale.
- Feature Extraction: Extract particle shape, texture and spatial patterns together with qualified EDS measurements. Preserve imaging conditions, blank/support spectra and sampling location. Correlations between elemental patterns and deposits are candidate features, not unique chemical identities.
- Pattern Recognition and Classification: Train supervised models such as Convolutional Neural Networks (CNNs) on labels supported by independent characterization. Separate training and test specimens by membrane or plant, rather than leak adjacent image patches across sets. Report per-class errors and unknown/mixed cases; Ca/O/C-rich deposits cannot be definitively called calcium carbonate from EDS alone, nor can C/O/N/P establish biofouling. Unsupervised clusters are patterns to investigate, not confirmed new compounds.
- Quantification and Spatial Mapping: Validate area segmentation and elemental quantification against suitable references. Surface image coverage is not automatically foulant mass fraction or whole-element composition. Report sampled locations, uncertainty, preparation effects and expert review of mixed or layered deposits.
ML-assisted review may shorten repetitive image analysis if validated, but total turnaround also includes shipping, sample preparation, instrument time, confirmatory tests and expert interpretation. Measure end-to-end time and accuracy; no universal improvement from weeks to hours is established by the workflow description.
Measurements for evaluating an assisted-autopsy workflow
| Parameter | Existing laboratory workflow | Candidate ML-assisted workflow |
|---|---|---|
| Diagnostic lead time | Record sample receipt through approved report | Include preparation, confirmation and human review |
| Foulant classification | Validate reference labels and analyst disagreements | Use independent specimens, per-class errors and unknown-case rejection |
| CIP decisions | Record approved trials and recovered performance | Require compatible chemistry and reviewed evidence before a trial |
| Membrane availability | Use a comparable operating-history baseline | Measure actual shutdowns and outcomes after approved changes |
| Analysis cost per sample | Obtain the current laboratory scope and quote | Include instruments, validation, expert review and software costs |
| Maintenance prediction | Separate sampled observations from time trends | Validate against prospective operating data before using forecasts |
| Repeatability and bias | Test analyst and preparation variability | Test instrument, feed, specimen and model-version changes |
Implementation and Integration into Digital O&M Strategies
Autopsy findings can support digital maintenance when linked to operating records and independently confirmed causes. A digital twin does not make a postmortem image predictive by itself. Evaluate the following uses through reviewed trials:
- Optimized CIP Regimes: Use confirmed deposit chemistry and the installed membrane’s approved cleaning limits to select a trial. An Si/O-rich EDS signal must not automatically trigger fluoride-based cleaning; neither elemental patterns nor ML scores authorize a cleaning recipe. Check reagent compatibility, concentration, pH, temperature, handling and waste route, then verify flux and rejection after cleaning.
- Proactive Pre-treatment Adjustments: Recurring deposits may prompt investigation of coagulation, filters, carryover or corrosion. Confirm the source with feed data, process inspection and complementary analysis before adjusting dosing or backwash; the same elemental pattern can have different origins.
- Enhanced Membrane Selection and Design: A consistently sampled, confirmed dataset can inform material selection and research. Confirm that differences reflect membrane or feed effects rather than sampling and image-preparation bias.
- Predictive Maintenance Scheduling: Relate confirmed observations to normalized flux, salt passage and pressure-drop history. A model requires prospective validation and an operating envelope before recommending CIP timing; no guaranteed life extension follows from integrating it with a digital twin.
Limits and honest boundaries
While AI-powered membrane autopsy represents a significant leap, its efficacy is inherently tied to the quality of upstream processes and the comprehensiveness of its training data. The system is only as robust as the samples provided:
- Sample Integrity: Improper sampling, handling, or preservation of membrane sections can introduce artifacts or alter foulant chemistry, leading to misdiagnosis.
- Pre-treatment Efficacy: Heavy deposits may obscure underlying structures. Preserve and document the original sample; any washing, extraction or layer removal must be recorded and compared with an untreated section to avoid erasing the evidence.
- Instrumentation Quality: The accuracy of SEM/EDS data, including spatial resolution and elemental detection limits, is paramount. Substandard instrumentation will yield unreliable input for the ML models.
- Training Data Bias: ML models are trained on historical data. While robust for known foulant types, the system may initially struggle with entirely novel foulant chemistries or morphologies without human expert validation and subsequent model retraining.
- Dynamic Biological Activity: SEM/EDS records morphology and elements, not direct biological activity. Confirm suspected biofilm with appropriate complementary methods; it cannot establish live/dead ratios or metabolic activity from elemental patterns.
- Complex Interactions: In highly mixed fouling scenarios, disentangling superimposed elemental signals and morphological features can be challenging, even for advanced ML, sometimes necessitating iterative analysis and expert review.
Maintain a documented dataset, model version, validation record and analyst sign-off. Expand labels only after independent confirmation, monitor shifts in feed and instrumentation, and allow an inconclusive result when the evidence does not support a cause.
FAQ
Q2: What is the typical turnaround time for an AI-assisted autopsy report, and how does it compare to traditional methods? A2: Turnaround depends on sample transport, laboratory capacity, preparation, confirmatory analyses and review. Obtain a laboratory-specific scope and schedule rather than assume a universal AI service time. Benchmark the same sample types and report requirements with and without assistance, including expert corrections. References: Thermo Fisher complementary molecular analysis for SEM/EDS and DuPont FilmTec technical manual.
Related equipment & product lines
These categories typically support the approach above—open any line to compare brands and models.
- RO MembranesReverse osmosis membrane elements for municipal and industrial desalination.View category →
- Instrumentation & SensorsInstruments and sensors for online monitoring of flow, level, pressure, temperature, and water quality.View category →
- Pilot Units TestingPilot rigs and trial modules for process validation and feasibility studies.View category →
For a closer review, use the engineering inquiry form to share feed, capacity, target, and project stage. Submission does not constitute a completed design or performance commitment.