Solutions · Digital & Smart O&M
Process Performance Benchmarking: compare your KPIs to anonymized engineering evaluation operating datasets
Normalize kWh/m³, chemical intensity, and membrane KPIs against peers—turning private data into actionable gap analysis, not vanity scores.
Use this guide within its scope
This page supports technical research and option comparison and is marked 2026. Illustrative values are not a quotation, completed process design, certification conclusion, or performance guarantee. Check current regulations, feed data, tests, and OEM records.
Problem
Owners know their plant is 'different'—but cannot quantify whether pain is structural or operational.
Technology
Privacy-preserving cohorts and agreed metric definitions so comparisons are apples-to-apples.
Results
Prioritized improvement backlog: where to instrument deeper, where to change setpoints, where to redesign.
Engineering decision card
Use when
Owners know their plant is 'different'—but cannot quantify whether pain is structural or operational.
Evaluate first
Privacy-preserving cohorts and agreed metric definitions so comparisons are apples-to-apples.
Inputs still required
Feed source and variability, capacity, target quality, operating hours, discharge or reuse boundary, available space, and utilities.
Comparison output
Prioritized improvement backlog: where to instrument deeper, where to change setpoints, where to redesign. The final decision still needs feed data, mass balance, and any necessary testing.
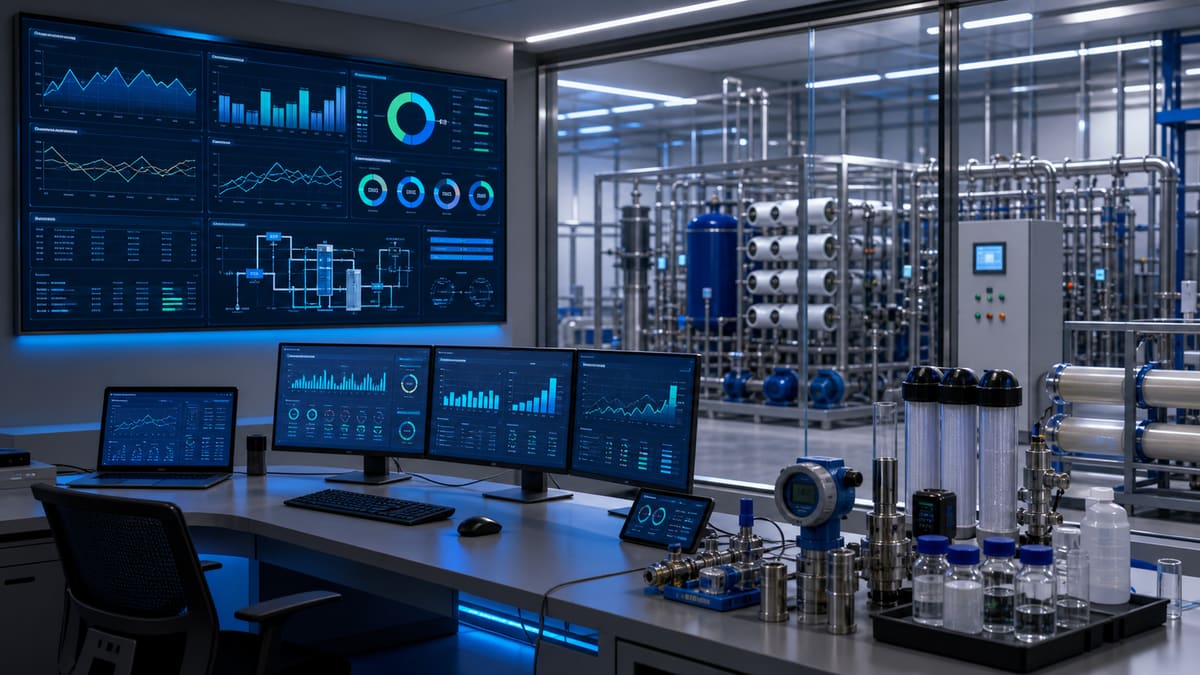
Traditional vs engineering evaluation path
Optimizing critical processes, like membrane cleaning cycles in a water treatment plant, often involves a blend of experience and reactive troubleshooting. With this approach, this becomes a proactive, data-informed strategy.
| Traditional way | engineering evaluation path way |
|---|---|
| Manual KPI Tracking & Guesswork | Automated, Real-time Benchmarking |
| Operators track flux decay and pressure drop manually, triggering membrane cleaning based on rules-of-thumb or predefined schedules. | Online instruments feed data directly to engineering evaluation path platform. AI analyzes current performance against a global benchmark of similar membrane systems. |
| Outcome: Cleaning is often too early (wasting chemicals, shortening membrane life) or too late (leading to reduced production, emergency cleaning, or irreversible fouling). | Outcome: Optimal cleaning cycles are recommended and even automated, minimizing chemical usage, extending membrane life, and maintaining peak production efficiency. For a typical plant, this can reduce cleaning frequency by 15-20% while sustaining throughput. |
| Reactive Maintenance & Unplanned Downtime | Predictive Maintenance & Proactive Optimization |
| A critical spare part for the cleaning system (e.g., a specific pump seal) is ordered only when failure occurs, leading to production stoppages and expediting costs. | engineering evaluation path identifies deviations from benchmarked operational norms, flagging potential component degradation before failure. This triggers an automated spare part order through the digital supply chain. |
| Outcome: Unplanned downtime impacts output, increases maintenance costs by 30-50% due to emergency repairs and expedited shipping, and disrupts downstream processes. | Outcome: Spares arrive just-in-time, preventing failures. Downtime is minimized, spare part inventory is optimized, and supply chain disruptions are anticipated and mitigated, enhancing overall operational certainty and cutting emergency costs. |
| Isolated Data & Limited Improvement Scope | Holistic View & Continuous Optimization |
| Performance data is siloed within local SCADA systems, making trend analysis difficult and comparison to other facilities impossible without significant manual effort. | Aggregated, anonymized data from thousands of operational units worldwide provides rich context for your specific process parameters. |
| Outcome: Improvement efforts are often localized, based on limited data, and prone to "reinventing the wheel" without learning from broader industry experience. | Outcome: Data-driven insights identify best practices and quantify the potential gains from specific process adjustments, ensuring continuous improvement based on real-world performance benchmarks. |
The Foundation of Truth: Instrumentation & Sensors
Robust process performance benchmarking hinges on accurate, reliable field data. The decisions derived from comparing your KPIs to global standards are only as good as the online instruments capturing flow, pressure, conductivity, ORP, level, and other critical parameters. High-quality, properly calibrated sensors are the eyes and ears of your digital twin, providing the ground truth necessary for precise benchmarking and actionable insights.
These sensors generate the continuous data streams that fuel this approach's analytical engine, enabling real-time performance evaluation and predictive modeling. Without this rich, granular dataset from your operational assets, benchmarking becomes guesswork, and optimization remains theoretical.
engineering evaluation path Differentiation: Coordinated Certainty
Our platform continuously monitors your equipment performance against global benchmarks, identifying deviations that signal potential issues or optimization opportunities. When a benchmark indicates a component is underperforming or nearing end-of-life, our system can automatically trigger a precisely timed spare part order through our digital supply chain network. This ensures the right part arrives exactly when needed, minimizing inventory holding costs while eliminating the risk of stockouts and production delays.
FAQ
Q: How quickly can we expect to see tangible results and ROI from implementing this approach's benchmarking service? A: The speed of results can vary depending on your starting point and the complexity of your operations. However, customers typically begin to see actionable insights within the first 3-6 months as sufficient data is collected and analyzed against our global benchmarks. Many clients report initial efficiency gains (e.g., reduced chemical consumption, optimized energy use, extended asset life) leading to a positive ROI within the first year, driven by proactive maintenance scheduling and process optimization recommendations. The long-term benefits of continuous improvement and enhanced operational certainty continue to accrue thereafter.
Related equipment & product lines
These categories typically support the approach above—open any line to compare brands and models.
- Instrumentation & SensorsOnline measurement and control: flow, level, pressure, and water-quality sensors indexed from the Lenntech instrumentation hub.View category →
- RO MembranesReverse osmosis membrane elements for municipal and industrial desalination.View category →
- InvertersVariable-frequency drives and inverter systems for variable-speed motor control.View category →
For a closer review, use the engineering inquiry form to share feed, capacity, target, and project stage. Submission does not constitute a completed design or performance commitment.