Solutions · Sustainability & ESG
Solar-Powered Water Desalination: zero-carbon supply for off-grid and fringe-of-grid sites
DC-coupled RO, buffering, and load-following design for remote water—bankable LCOW and defensible carbon narratives.
Use this guide within its scope
This page supports technical research and option comparison and is marked 2026. Illustrative values are not a quotation, completed process design, certification conclusion, or performance guarantee. Check current regulations, feed data, tests, and OEM records.
Problem
Diesel gensets make water expensive and carbon-heavy; renewables need controls that respect membranes.
Technology
PV sizing with RO turndown, storage, and harmonized SCADA setpoints.
Results
Export-ready ESG story: MWh from renewable fraction and avoided diesel litres.
Engineering decision card
Use when
Diesel gensets make water expensive and carbon-heavy; renewables need controls that respect membranes.
Evaluate first
PV sizing with RO turndown, storage, and harmonized SCADA setpoints.
Inputs still required
Feed source and variability, capacity, target quality, operating hours, discharge or reuse boundary, available space, and utilities.
Comparison output
Export-ready ESG story: MWh from renewable fraction and avoided diesel litres. The final decision still needs feed data, mass balance, and any necessary testing.
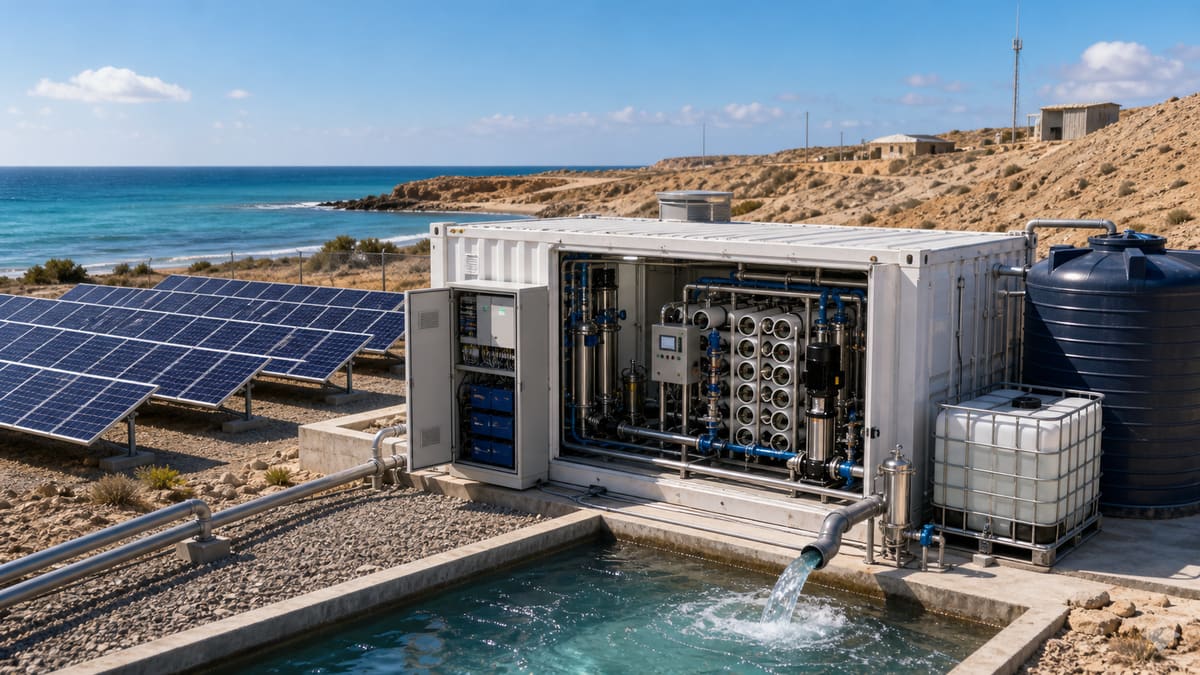
Solar-Powered Water Desalination: zero-carbon supply for off-grid and fringe-of-grid sites
Solar-powered water desalination offers a transformative solution, decoupling water production from fossil fuels and vulnerable grids. By harnessing the sun's abundant energy, industries can establish independent, zero-carbon water sources, significantly reducing both operational expenditure and Scope 1 and 2 emissions. This strategy not only enhances water security and operational resilience but also provides a clear pathway to meet evolving ESG disclosure requirements, proving a commitment to sustainable practices that resonate deeply within European and international supply chains.
The Imperative for Off-Grid Water Solutions
Many high-value industrial processes, including mining, agriculture, manufacturing, and tourism infrastructure, are often located far from reliable freshwater sources or robust energy grids. Historically, this has necessitated energy-intensive conventional desalination powered by diesel generators or an unstable grid connection. Both approaches carry substantial environmental and economic penalties, from greenhouse gas emissions and high fuel logistics costs to vulnerability to fuel price fluctuations and power outages. Solar-powered desalination directly addresses these vulnerabilities, offering a self-sufficient and environmentally responsible alternative that aligns with a future-proof green transition strategy.
Worked energy / carbon sketch
To illustrate the tangible environmental and economic benefits, let's consider an illustrative remote industrial facility requiring a consistent water supply.
Scenario: A facility needs 100 cubic metres per day (m³/day) of desalinated water. Traditional approach: Historically powered by a diesel generator. this approach solution: Implementation of a dedicated solar PV array with battery storage, eliminating diesel use for desalination.
Assumptions (illustrative):
- Specific energy consumption for desalination (e.g., Reverse Osmosis): 4 kWh/m³
- Operating days per year: 360 days (allowing for maintenance)
- Diesel generator efficiency: 3.0 kWh per litre of diesel
- CO₂e emissions factor for diesel: 2.68 kg CO₂e per litre of diesel
Calculation:
- Annual water production: 100 m³/day * 360 days/year = 36,000 m³/year
- Annual energy demand: 36,000 m³/year * 4 kWh/m³ = 144,000 kWh/year
- Equivalent diesel consumption avoided: 144,000 kWh/year / 3.0 kWh/litre = 48,000 litres of diesel/year
- Annual CO₂e emissions avoided: 48,000 litres/year * 2.68 kg CO₂e/litre = 128,640 kg CO₂e/year
This translates to ~128.6 tonnes of CO₂e avoided annually. This significant reduction in Scope 1 emissions not only contributes directly to decarbonisation targets but also eliminates the logistical burden and cost associated with transporting and storing 48,000 litres of diesel to a remote site each year. This is a powerful metric for ESG reporting and demonstrating genuine commitment to sustainability.
Traditional vs engineering evaluation path
| Aspect | Off-grid diesel / unstable grid RO | engineering evaluation path solar (PV + storage) RO |
|---|---|---|
| Carbon & OPEX | Scope 1 from diesel; fuel logistics and price volatility dominate OPEX. | Low-carbon MWh to water; stable LCOW story once assets are in service. |
| Resilience | Single point of failure on genset fuel supply. | BESS + controls for night/cloud; optional slim backup for critical duty. |
| ESG positioning | Hard to defend in EU/UK buyer screens. | Renewable fraction and kWh/m³ logging map cleanly to disclosure questions. |
Advancing Water Stewardship through Data & Transparency
This comprehensive data allows organisations to accurately track their water footprint and associated energy use, forming the bedrock for credible reporting to frameworks like the CDP Water Security and Climate Change questionnaires, or compliance with the Alliance for Water Stewardship (AWS) Standard. By documenting the mass and energy balance of your water systems, you can confidently demonstrate tangible progress in reducing operational impacts, meeting stakeholder expectations, and navigating the increasing scrutiny from international buyers and investors who demand evidence-based sustainability claims. this approach ensures that this data is not only accessible but also contextualised for clear communication of your sustainability journey.
Carbon savings calculator (illustrative)
Estimate annual electricity savings and avoided CO₂e when specific energy improves (e.g. after ERD, VFD tuning, or train optimization). Replace defaults with your meter data and your grid emission factor from your utility or ESG methodology.
ΔkWh/year ≈ Q(m³/h) × hours/year × (kWh/m³before − kWh/m³after) · tCO₂e ≈ ΔkWh × factor / 1000
Δ specific energy: 1.00 kWh/m³
Estimated electricity savings: 800,000 kWh/year
Indicative avoided emissions: 336 tCO₂e/year
Related equipment & product lines
These categories typically support the approach above—open any line to compare brands and models.
- InvertersVariable-frequency drives and inverter systems for variable-speed motor control.View category →
- RO MembranesReverse osmosis membrane elements for municipal and industrial desalination.View category →
- Pumps & PumpingHigh-pressure and process pump solutions for water treatment skids and plants.View category →
For a closer review, use the engineering inquiry form to share feed, capacity, target, and project stage. Submission does not constitute a completed design or performance commitment.