Solutions · Sustainability & ESG
Compliance with UK Water Regulations: export-oriented environmental positioning
High-level orientation on consenting culture, trade compliance, and documentation buyers expect—not legal advice.
Use this guide within its scope
This page supports technical research and option comparison and is marked 2026. Illustrative values are not a quotation, completed process design, certification conclusion, or performance guarantee. Check current regulations, feed data, tests, and OEM records.
Problem
Selling into UK/EU supply chains means environmental due diligence on equipment and processes.
Technology
Documentation packs, traceability, and test evidence aligned to buyer questionnaires.
Results
Faster vendor approval and fewer last-minute FAT surprises.
Engineering decision card
Use when
Selling into UK/EU supply chains means environmental due diligence on equipment and processes.
Evaluate first
Documentation packs, traceability, and test evidence aligned to buyer questionnaires.
Inputs still required
Feed source and variability, capacity, target quality, operating hours, discharge or reuse boundary, available space, and utilities.
Comparison output
Faster vendor approval and fewer last-minute FAT surprises. The final decision still needs feed data, mass balance, and any necessary testing.
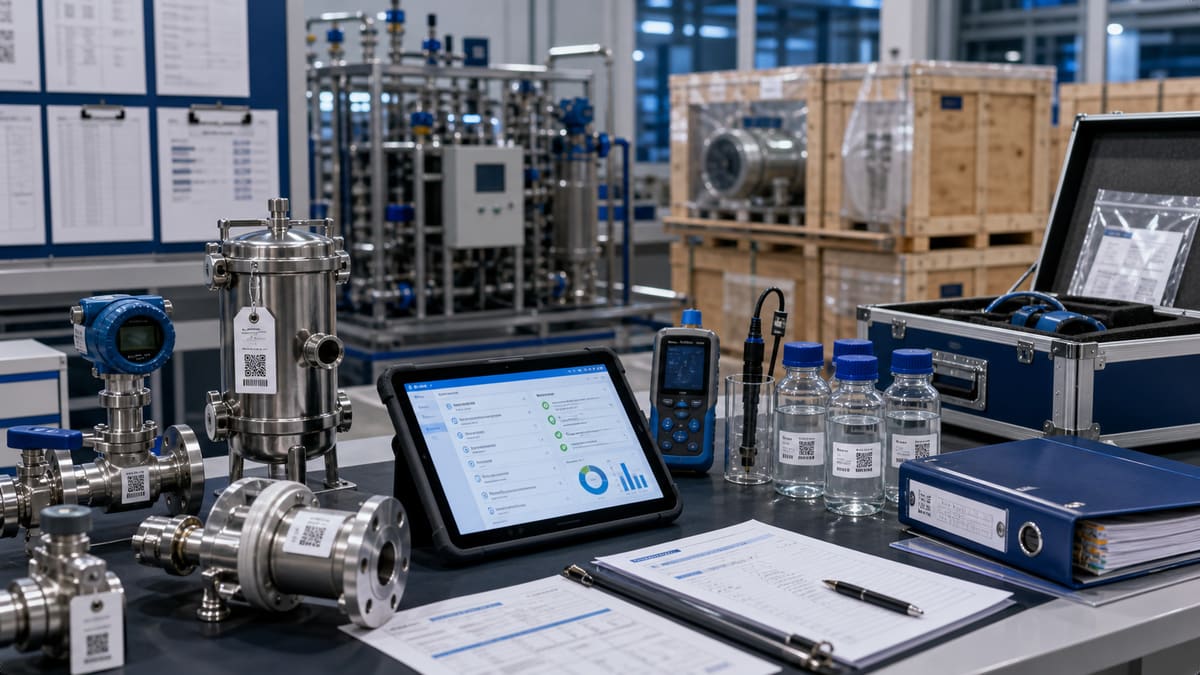
Compliance with UK Water Regulations: Export-Oriented Environmental Positioning
The United Kingdom, post-Brexit, maintains a stringent regulatory framework for industrial water use and discharge, largely building upon former EU directives. Key legislation such as the Environmental Permitting Regulations (EPR) governs activities that could impact water quality, requiring permits for discharges to controlled waters. The Water Industry Act outlines duties for water and sewerage companies, while specific regulations address hazardous substances, groundwater protection, and pollution prevention. For any enterprise seeking to export to or operate within the UK, understanding and exceeding these benchmarks is paramount. Buyers, especially in sectors with high sustainability commitments, increasingly integrate water stewardship and carbon footprint into their supplier selection criteria, driven by their own Scope 3 emissions reporting obligations. Navigating this landscape effectively requires not just compliance, but a transparent, data-driven approach to environmental performance.
Worked energy / carbon sketch
Consider an industrial facility processing 50 m³/hour of wastewater, operating 24 hours a day, 300 days a year, requiring an upgrade to meet stricter discharge limits. A traditional treatment approach might involve energy-intensive aeration, chemical dosing, and high-pressure membrane filtration. An this approach-optimized solution, leveraging advanced oxidation or electrochemical technologies combined with optimized filtration, could significantly reduce the specific energy demand.
Assumptions (Illustrative):
- Operating hours (H): 24 hours/day * 300 days/year = 7,200 hours/year
- Flow rate (Q): 50 m³/hour
- Baseline specific energy consumption (traditional system): 1.5 kWh/m³
- this approach specific energy consumption (optimized system): 0.8 kWh/m³
- Grid carbon intensity (UK 2026 forecast): 0.15 kg CO₂e/kWh (Source: Illustrative projection based on National Grid ESO Future Energy Scenarios)
Calculation:
- Energy saved per m³ (ΔkWh/m³): 1.5 kWh/m³ - 0.8 kWh/m³ = 0.7 kWh/m³
- Total annual volume treated: 50 m³/hour * 7,200 hours/year = 360,000 m³/year
- Total annual energy savings: 360,000 m³/year * 0.7 kWh/m³ = 252,000 kWh/year
- Annual carbon emissions reduction: 252,000 kWh/year * 0.15 kg CO₂e/kWh = 37,800 kg CO₂e/year
- Expressed in tonnes CO₂e/year: 37,800 kg CO₂e / 1,000 = 37.8 tonnes CO₂e/year
This illustrative sketch demonstrates how optimizing water treatment, even for a moderately sized facility, can lead to substantial, verifiable reductions in operational energy consumption and associated carbon emissions, directly impacting a company's Scope 2 footprint.
Traditional vs engineering evaluation path
| Topic | Generic kit + paper O&M | Export-oriented evidence pack (engineering evaluation path) |
|---|---|---|
| Permit story | “We meet the limit” without traceability. | Tagged test reports, FAT checklists, and serialised critical items. |
| Intensity | High chem/energy per m³ opaque to buyers. | Logged dose, kWh/m³, sludge, and residuals for questionnaires. |
| Risk | Late surprises in UK/EU vendor due diligence. | Documentation aligned to common buyer templates—not legal advice. |
Carbon savings calculator (illustrative)
Estimate annual electricity savings and avoided CO₂e when specific energy improves (e.g. after ERD, VFD tuning, or train optimization). Replace defaults with your meter data and your grid emission factor from your utility or ESG methodology.
ΔkWh/year ≈ Q(m³/h) × hours/year × (kWh/m³before − kWh/m³after) · tCO₂e ≈ ΔkWh × factor / 1000
Δ specific energy: 1.00 kWh/m³
Estimated electricity savings: 800,000 kWh/year
Indicative avoided emissions: 336 tCO₂e/year
Related equipment & product lines
These categories typically support the approach above—open any line to compare brands and models.
- Control ValvesProcess control and softening valves for automated treatment trains.View category →
- Instrumentation & SensorsOnline measurement and control: flow, level, pressure, and water-quality sensors indexed from the Lenntech instrumentation hub.View category →
- UV DisinfectionUV systems and modules for pathogen inactivation and final disinfection barriers.View category →
For a closer review, use the engineering inquiry form to share feed, capacity, target, and project stage. Submission does not constitute a completed design or performance commitment.