Solutions · Sustainability & ESG
Internal Water Loop Optimization: less raw-water withdrawal, higher reuse ratio
Water balance workshops, cascade reuse, and quality ladders—metrics buyers can defend to AWS and CDP-style questionnaires.
Use this guide within its scope
This page supports technical research and option comparison and is marked 2026. Illustrative values are not a quotation, completed process design, certification conclusion, or performance guarantee. Check current regulations, feed data, tests, and OEM records.
Problem
Plants withdraw more than they need because loops are siloed and unmeasured.
Technology
Metering plan + cascade design + treatment fit-for-purpose.
Results
Higher reuse % and lower intake m³/ton product.
Engineering decision card
Use when
Plants withdraw more than they need because loops are siloed and unmeasured.
Evaluate first
Metering plan + cascade design + treatment fit-for-purpose.
Inputs still required
Feed source and variability, capacity, target quality, operating hours, discharge or reuse boundary, available space, and utilities.
Comparison output
Higher reuse % and lower intake m³/ton product. The final decision still needs feed data, mass balance, and any necessary testing.
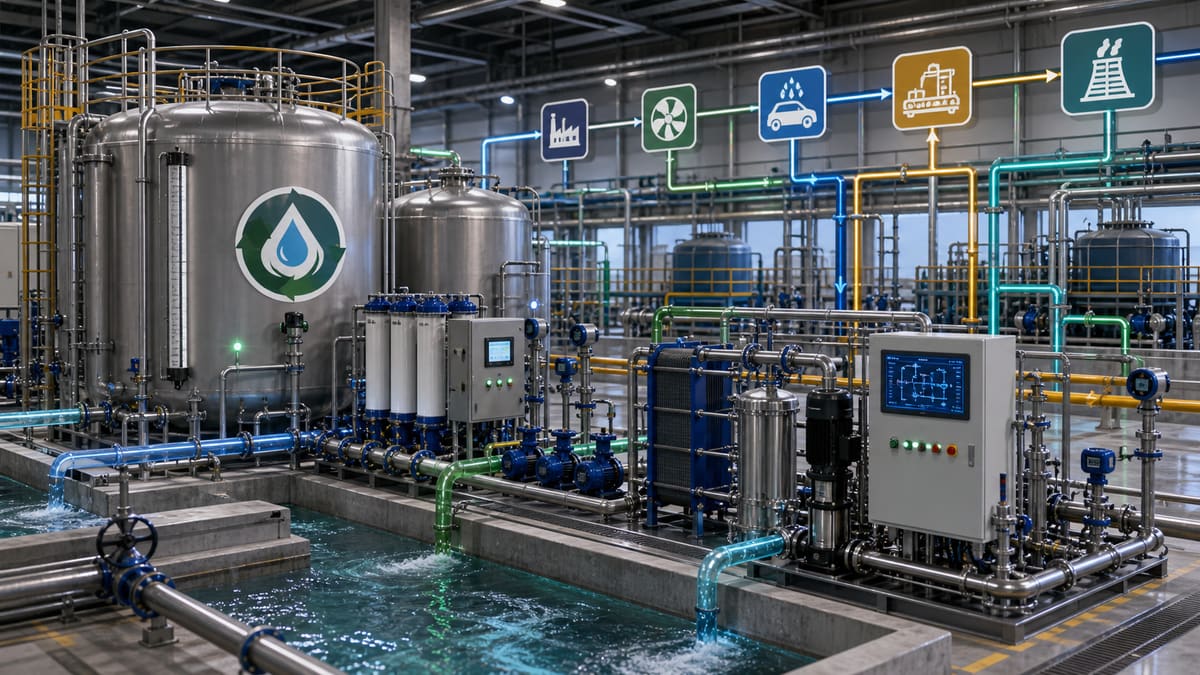
Internal Water Loop Optimization: less raw-water withdrawal, higher reuse ratio
Industrial water management is rapidly evolving from a cost centre to a strategic enabler of operational resilience, carbon reduction, and market access. For facilities operating within or supplying to the UK and EU, stringent environmental regulations, escalating water scarcity, and the growing demand for transparent ESG disclosures (e.g., through frameworks like the EU's Corporate Sustainability Reporting Directive or Germany's Supply Chain Due Diligence Act) are transforming water loops into critical nodes for both risk mitigation and competitive advantage. Optimising internal water loops to reduce raw-water withdrawal and increase reuse ratios is no longer just good practice; it’s a necessary strategy for mitigating water risk, lowering operational carbon footprints, and meeting the evolving sustainability expectations of international buyers and investors.
Each cubic meter of water abstracted, treated, transported, and discharged represents not only a direct financial cost but also embedded energy consumption and associated greenhouse gas emissions. As water stress intensifies globally, and particularly in regions supplying European markets, secure and efficient water access directly impacts supply chain stability and brand reputation. Proactive internal water loop optimization, powered by smart technologies and data-driven insights, offers a pathway to significantly reduce reliance on external water sources, enhance process efficiency, and bolster your organisation's environmental credentials in a verifiable manner.
Worked energy / carbon sketch
Consider an industrial facility that reuses 200 m³/hour of its process water, avoiding the need to abstract and treat an equivalent volume of raw water.
Assumptions (illustrative, for back-of-envelope calculation):
- Hours of operation: 7,500 hours per year.
- Energy intensity for raw water abstraction & basic treatment: 0.4 kWh/m³ (e.g., pumping from a distant source, basic clarification, filtration).
- Energy intensity for internal advanced reuse treatment: 0.2 kWh/m³ (e.g., fine filtration, UV disinfection, or an advanced oxidation process tailored for reuse).
- Grid carbon intensity factor: 0.2 kg CO₂e/kWh (representing a plausible average for grid electricity in the UK/EU in 2026, assuming continued decarbonisation).
Calculation:
- Net energy saving per m³ reused: (Energy for raw water - Energy for reuse treatment) = (0.4 kWh/m³ - 0.2 kWh/m³) = 0.2 kWh/m³.
- Total annual energy savings: 200 m³/hour × 7,500 hours/year × 0.2 kWh/m³ = 300,000 kWh/year.
- Total annual carbon savings: 300,000 kWh/year × 0.2 kg CO₂e/kWh = 60,000 kg CO₂e/year = 60 tonnes CO₂e/year.
This illustrative calculation demonstrates that optimizing internal water loops can yield substantial annual energy and carbon savings, directly contributing to Scope 2 emissions reductions and improved operational efficiency.
Traditional vs engineering evaluation path
| Traditional Approach | engineering evaluation path Approach |
|---|---|
| Problem Diagnosis: Reactive, often after a failure or regulatory non-compliance. Relies on intermittent manual sampling and limited historical data. | Problem Diagnosis: Proactive and predictive. Real-time, continuous online monitoring of critical parameters detects anomalies and trends before issues escalate. Integrated data analytics pinpoint inefficiencies. |
| System Design & Implementation: Fragmented, using separate vendors for different stages (e.g., intake, process, wastewater). Disconnected systems lead to suboptimal integration and compatibility challenges. | System Design & Implementation: Holistic, integrated, and modular solutions. engineering evaluation path assesses the entire water lifecycle, designing interconnected systems with proven technologies and a focus on future-proofing for scalability and evolving regulations. |
| Operational Efficiency: Suboptimal energy and chemical consumption due to lack of granular insight. Manual adjustments, often leading to over-dosing or inefficient pump operations. High OPEX due to inefficiencies. | Operational Efficiency: Data-driven optimisation. AI/ML algorithms learn from operational data to fine-tune chemical dosing, pump speeds, and treatment parameters, significantly reducing energy and chemical use. Maximised OPEX efficiency and CAPEX ROI. |
| Water Quality Control: Manual lab testing provides delayed results, making real-time quality adjustments difficult. Risk of process disruption or product quality issues if parameters drift. | Water Quality Control: Continuous, real-time water quality monitoring throughout the loop. Automated alerts and control systems ensure water quality remains within precise specifications for each reuse application, protecting processes and products. |
| ESG & Disclosure: Difficult to accurately quantify water-related metrics (e.g., withdrawal, discharge, reuse ratios, embedded carbon) for reporting frameworks. Data gaps lead to estimations and reduced credibility. | ESG & Disclosure: Comprehensive, verifiable data collection on water volumes, quality, energy consumption, and chemical usage. Provides auditable records for CDP Water Security, AWS, and other ESG reporting, enhancing transparency and investor confidence. |
| Future Resilience: Vulnerable to increasing water scarcity, rising costs, and stricter regulations. Limited adaptability to changes in raw water quality or production demands. | Future Resilience: Enhanced operational resilience. Reduced reliance on external water sources, adaptable systems designed for varying conditions, and continuous optimisation prepare facilities for future environmental and regulatory challenges. |
Robust internal water loop optimization, underpinned by precise metering and a comprehensive understanding of mass and energy balances, forms the bedrock of credible water stewardship. Solutions that provide continuous, verifiable data—from raw water intake to each point of reuse and final discharge—are indispensable for fulfilling increasingly stringent ESG reporting requirements. This data directly supports robust responses to questionnaires from platforms like CDP Water Security and the Alliance for Water Stewardship (AWS) Standard, providing the granular insights necessary to demonstrate measurable progress. By establishing a clear, documented chain of custody for water, industrial operators can accurately report on water withdrawal, consumption, recycling, and reuse, significantly enhancing their transparency and credibility with stakeholders. This verifiable data helps articulate a narrative of responsible resource management without resorting to unsubstantiated claims.
Carbon savings calculator (illustrative)
Estimate annual electricity savings and avoided CO₂e when specific energy improves (e.g. after ERD, VFD tuning, or train optimization). Replace defaults with your meter data and your grid emission factor from your utility or ESG methodology.
ΔkWh/year ≈ Q(m³/h) × hours/year × (kWh/m³before − kWh/m³after) · tCO₂e ≈ ΔkWh × factor / 1000
Δ specific energy: 1.00 kWh/m³
Estimated electricity savings: 800,000 kWh/year
Indicative avoided emissions: 336 tCO₂e/year
Related equipment & product lines
These categories typically support the approach above—open any line to compare brands and models.
- Instrumentation & SensorsOnline measurement and control: flow, level, pressure, and water-quality sensors indexed from the Lenntech instrumentation hub.View category →
- Pumps & PumpingHigh-pressure and process pump solutions for water treatment skids and plants.View category →
- UF ModulesUltrafiltration modules for suspended solids and colloid removal.View category →
For a closer review, use the engineering inquiry form to share feed, capacity, target, and project stage. Submission does not constitute a completed design or performance commitment.