Solutions · Sustainability & ESG
Energy Recovery in RO Systems: integrating ERDs to cut train energy 30%+
Isobaric ERDs and turbo-assisted SWRO/BWRO: how kWh/m³ drops, when payback works, and a worked sketch for annual electricity and CO₂e.
Use this guide within its scope
This page supports technical research and option comparison and is marked 2026. Illustrative values are not a quotation, completed process design, certification conclusion, or performance guarantee. Check current regulations, feed data, tests, and OEM records.
Problem
High-pressure concentrate still carries recoverable hydraulic energy—without ERD it is throttled away.
Technology
Isobaric exchangers and turbo trains sized to salinity, with meter-grade proof of specific energy.
Results
Double-digit % savings on high-pressure pumping are common when ERD integration is done correctly.
Engineering decision card
Use when
High-pressure concentrate still carries recoverable hydraulic energy—without ERD it is throttled away.
Evaluate first
Isobaric exchangers and turbo trains sized to salinity, with meter-grade proof of specific energy.
Inputs still required
Feed source and variability, capacity, target quality, operating hours, discharge or reuse boundary, available space, and utilities.
Comparison output
Double-digit % savings on high-pressure pumping are common when ERD integration is done correctly. The final decision still needs feed data, mass balance, and any necessary testing.
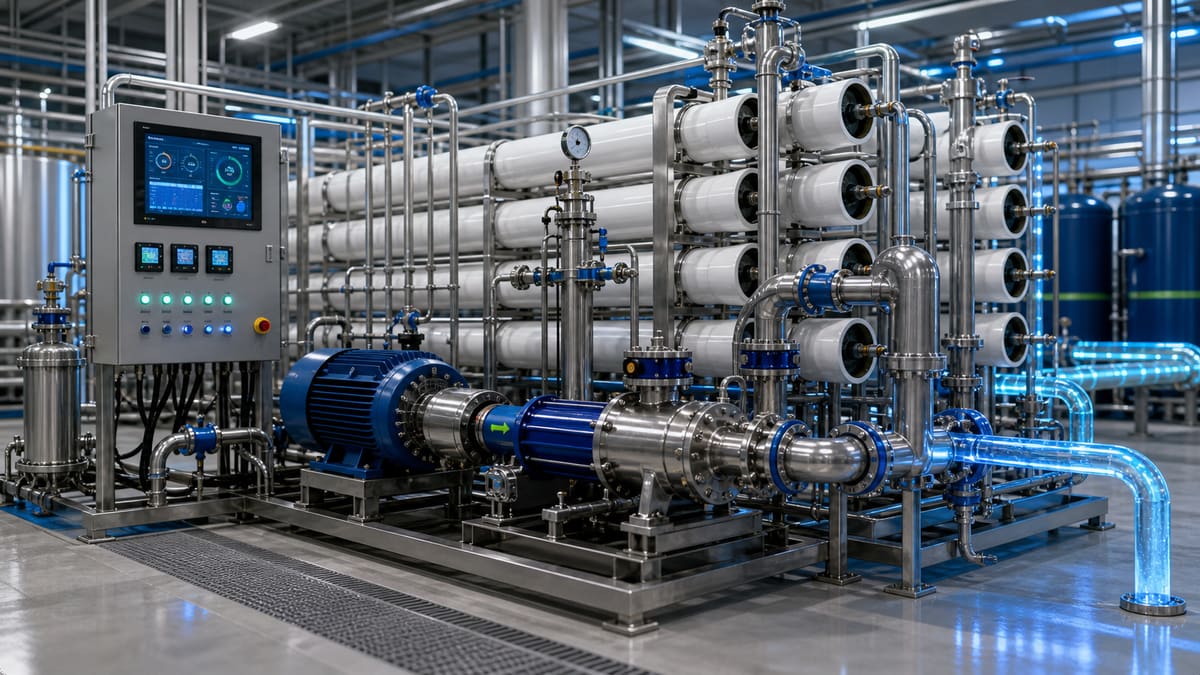
Energy Recovery in RO Systems: integrating ERDs to cut train energy 30%+
The global industrial landscape faces an unprecedented confluence of challenges: escalating water scarcity, volatile energy prices, and urgent mandates for decarbonisation. For industrial facilities relying on Reverse Osmosis (RO) for critical process water, a significant proportion of operating expenditure is often tied directly to energy consumption. This energy demand directly translates into carbon emissions, increasingly scrutinised by international regulatory bodies and, critically, by major industrial buyers in the EU and UK. These markets, with their stringent ESG (Environmental, Social, and Governance) reporting requirements, are rapidly turning sustainability performance into a non-negotiable gateway for supply chain participation.
High energy consumption in RO systems represents not only a financial burden but also a significant carbon liability and an increasing operational risk in an era of constrained energy supplies. Traditional RO setups, while effective in water purification, are inherently energy-intensive due to the high pressures required to overcome osmotic pressure. This is particularly true for seawater desalination or challenging industrial wastewater treatment. Without efficient energy recovery, a substantial amount of hydraulic energy in the concentrate stream — energy that was expended to pressurise the feed water — is simply wasted.
Energy Recovery Devices (ERDs) are sophisticated hydraulic machines engineered to reclaim a significant portion of this otherwise lost energy from the high-pressure concentrate (brine) stream of an RO system. Instead of being depressurised and discharged directly, the concentrate stream's kinetic and pressure energy is captured and used to boost the feed pressure, thereby reducing the workload on the main high-pressure pumps. Integrating state-of-the-art ERDs can dramatically decrease the specific energy consumption (kWh per cubic meter of permeate produced) by 30% or more, directly lowering both operational costs and the associated carbon footprint. This transition isn't just about efficiency; it's about building resilience, achieving compliance, and securing market access in a sustainability-driven economy.
Worked energy / carbon sketch
To illustrate the tangible impact of integrating Energy Recovery Devices (ERDs) into an industrial RO system, let's consider a practical scenario.
Assumptions (Illustrative):
- RO System Size: An industrial RO plant producing 2,400 cubic meters of permeate per day (Q = 100 m³/h).
- Operating Hours: The plant operates continuously for 8,000 hours per year (typical for industrial processes).
- Specific Energy Consumption (SEC) Before ERD: 4.0 kWh/m³ (representative for a medium-to-high salinity feed, e.g., brackish water or re-use application).
- Specific Energy Consumption (SEC) After ERD: 2.5 kWh/m³ (achievable with advanced isobaric ERDs, representing a 37.5% reduction).
- Grid Carbon Intensity: 0.20 kg CO₂e/kWh (an illustrative average for industrial electricity consumption in regions with a mixed energy supply).
Calculation:
-
Annual Permeate Production: 100 m³/h × 8,000 h/year = 800,000 m³/year
-
Total Annual Energy Consumption Before ERD: 800,000 m³/year × 4.0 kWh/m³ = 3,200,000 kWh/year
-
Total Annual Energy Consumption After ERD: 800,000 m³/year × 2.5 kWh/m³ = 2,000,000 kWh/year
-
Annual Energy Savings: 3,200,000 kWh/year - 2,000,000 kWh/year = 1,200,000 kWh/year
-
Annual CO₂e Emissions Saved: 1,200,000 kWh/year × 0.20 kg CO₂e/kWh = 240,000 kg CO₂e/year = 240 tonnes CO₂e/year
This illustrative sketch demonstrates that for an industrial RO system of this scale, integrating ERDs can lead to annual savings of 1.2 million kWh and an emission reduction of 240 tonnes of CO₂e, significantly contributing to both operational cost reduction and decarbonisation targets. Actual savings will vary based on feed water characteristics, system design, and local energy costs/grid factors.
Traditional vs engineering evaluation path
| Aspect | Traditional RO (no / partial ERD) | engineering evaluation path with integrated ERD |
|---|---|---|
| Energy & SEC | Concentrate pressure often throttled; high kWh/m³ and exposure to power-price swings. | Isobaric exchangers or turbo trains recover hydraulic energy; materially lower specific energy when sized to salinity and recovery. |
| ESG & metering | Sparse, non-aligned meter data; weak traceability for buyer questionnaires. | SCADA-aligned kWh/m³ and flow/pressure logging suited to CDP-style and water-stewardship narratives. |
| Delivery model | Discrete vendor interfaces; integration risk on the owner/EPC. | Single accountable train design: hydraulics, ERD, and controls engineered as one boundary. |
Beyond the direct energy and carbon savings, the integration of ERDs contributes to a more resilient and sustainable water treatment infrastructure. Reduced power draw lessens the thermal load on plant cooling systems, indirectly contributing to overall plant efficiency. Furthermore, by stabilising hydraulic conditions and reducing the stress on main high-pressure pumps, ERDs can extend the operational life of critical components, leading to lower maintenance costs and greater system reliability. This holistic benefit package positions ERD-equipped RO systems as a strategic investment for any industrial operation committed to long-term sustainability.
FAQ
Q1: What types of RO systems benefit most from ERD integration? ERDs offer significant benefits across various RO applications, especially those with high recovery rates or high feed salinities. This includes seawater desalination (SWRO), brackish water RO (BWRO) for industrial processes, and advanced industrial wastewater treatment and reuse systems. The higher the pressure and flow in the concentrate stream, the greater the potential for energy recovery.
Q2: What is the typical payback period for investing in ERDs? While highly dependent on factors like system size, energy costs, and specific application, industrial ERD integrations typically see payback periods ranging from 1 to 3 years. In regions with high electricity prices or carbon taxes, this period can be even shorter, making them a financially compelling investment in addition to their environmental benefits.
Carbon savings calculator (illustrative)
Estimate annual electricity savings and avoided CO₂e when specific energy improves (e.g. after ERD, VFD tuning, or train optimization). Replace defaults with your meter data and your grid emission factor from your utility or ESG methodology.
ΔkWh/year ≈ Q(m³/h) × hours/year × (kWh/m³before − kWh/m³after) · tCO₂e ≈ ΔkWh × factor / 1000
Δ specific energy: 1.00 kWh/m³
Estimated electricity savings: 800,000 kWh/year
Indicative avoided emissions: 336 tCO₂e/year
Related equipment & product lines
These categories typically support the approach above—open any line to compare brands and models.
- Pumps & PumpingHigh-pressure and process pump solutions for water treatment skids and plants.View category →
- InvertersVariable-frequency drives and inverter systems for variable-speed motor control.View category →
- RO MembranesReverse osmosis membrane elements for municipal and industrial desalination.View category →
For a closer review, use the engineering inquiry form to share feed, capacity, target, and project stage. Submission does not constitute a completed design or performance commitment.